
Rates held. Active inventory climbed. Pending contracts fell 17% in a single month. Here’s what the county numbers hide — and what’s next.
Hud’s Compass shows seller pricing discipline slipped across all three structures in June — but not evenly. One structure’s sellers had already reset months ago, and the report shows which one.
Mortgage rates held steady — 6.47% to 6.52% the entire month. Nothing moved. Buyers priced the same rate math into every offer they wrote. Rates were not the story.
Active inventory climbed — 1,810 homes on market in May, 1,888 in June. That’s 13% more than June 2025, and more listings than any June in three years.
Pending contracts fell off a cliff — 1,453 in May, 1,206 in June. A 17% drop in a single month. The Contract Ratio — contracts written per active listing — slid from 0.87 in April to 0.80 in May to 0.64 in June. A 26% collapse in six weeks.
Buyers didn’t stop existing. They stopped writing offers.
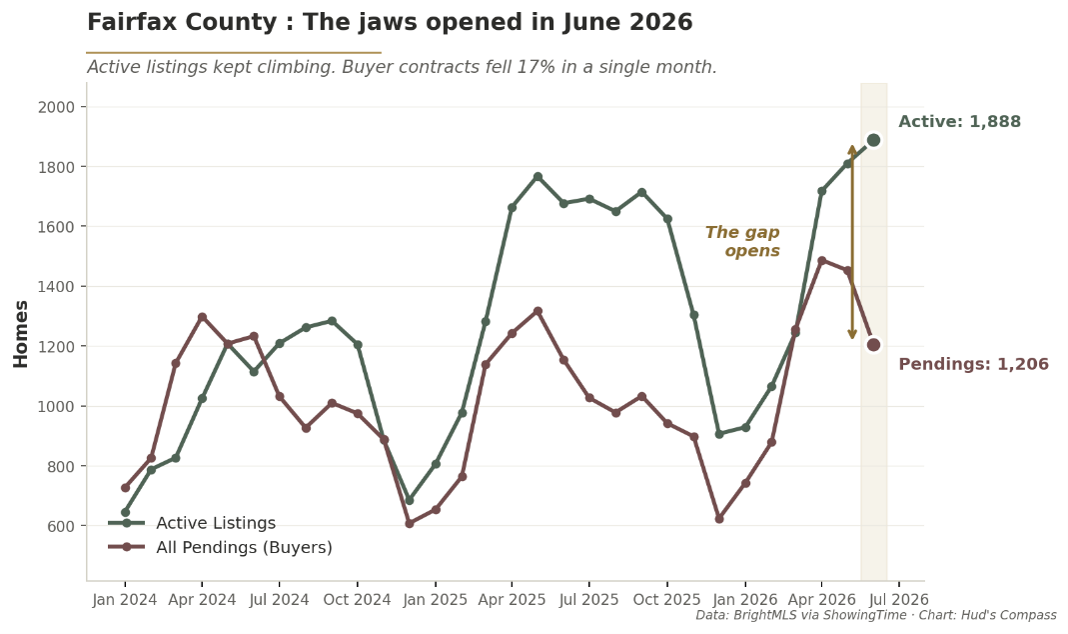
Look at where those two lines separate. That’s the annual Handoff, and it lands on the calendar, not on the headlines. Peak school-anchored buying runs from mid-April through the second week of June — families need to be under contract in time to close, move, and enroll. The second that window shuts, the buyer pool thins out and goes quiet until the pre-spring setup starts in January.
It happens every year. It happened again. That’s a turn, not a downturn.
But the county number is an average of three different markets.
Fairfax County isn’t one housing market. It’s three, and in June they behaved nothing alike.
First, the term that matters. The Contract Ratio compares homes going under contract against homes sitting active. At 1.0 you have one contract for every listing — a market in balance. Below 1.0, listings are accumulating faster than buyers are absorbing them. It’s a leading indicator: it moves before closed sales do, which means it tells you where the next 60 days are heading.
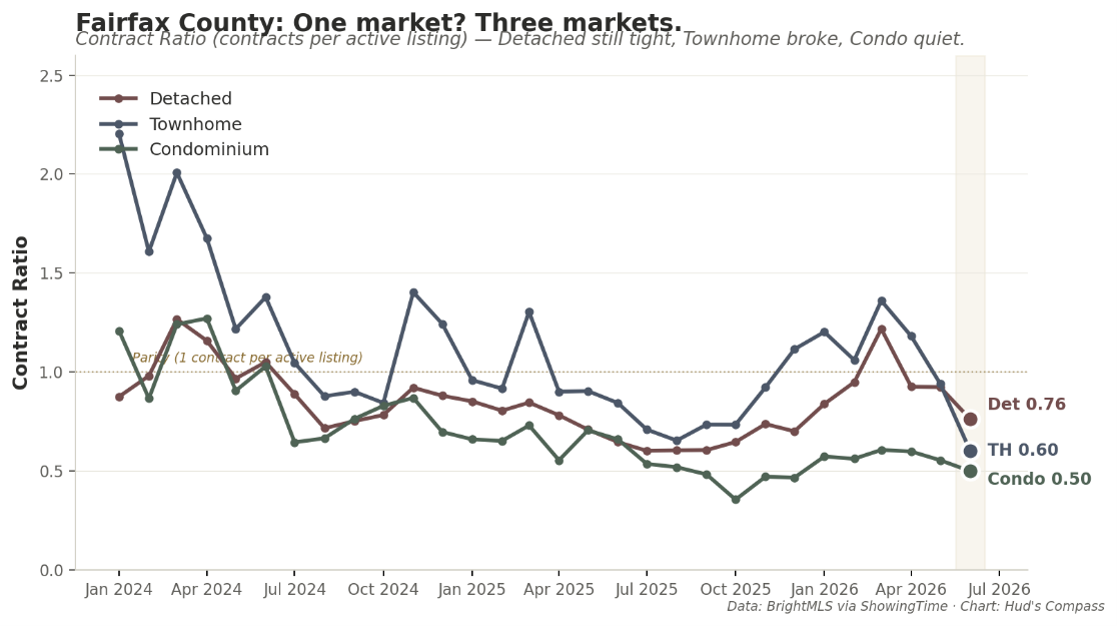
Detached — 0.76. The tightest structure in the county. Buyers slowed, but sellers pulled back too. The Detached buyer showed up late and still bought. Long-term school purchase.
Townhome — 0.60. The sharpest single-month break in the county, and it wasn’t close. Sellers listed for the spring window; the June buyer had already left. Less urgent, mid-term purchase.
Condominium — 0.50. The quietest structure, where the buyer has held real leverage for months. Not a June story. A months-long story. Savviest of buyers, appreciation is very slow and minimal.
HUD’S COMPASS
NVA’S ONLY MARKET INTELLIGENCE INDEX
The conditions data tells you what’s about to happen. The Compass tells you what just happened and what it means.
The Read tells you how to respond.
This month’s Fairfax County report reads the closed side of the same market: which structure’s sellers held their pricing discipline through the turn and which gave it up, where the opening price stopped working and the negotiation moved to terms, and what six years of equity data say about whether the compounding is over or just resting.
Seven pages. Three structures. Open it below.
Three structures. Three different turns. Same county.
Detached Homes — the buyer showed up late and bought anyway.
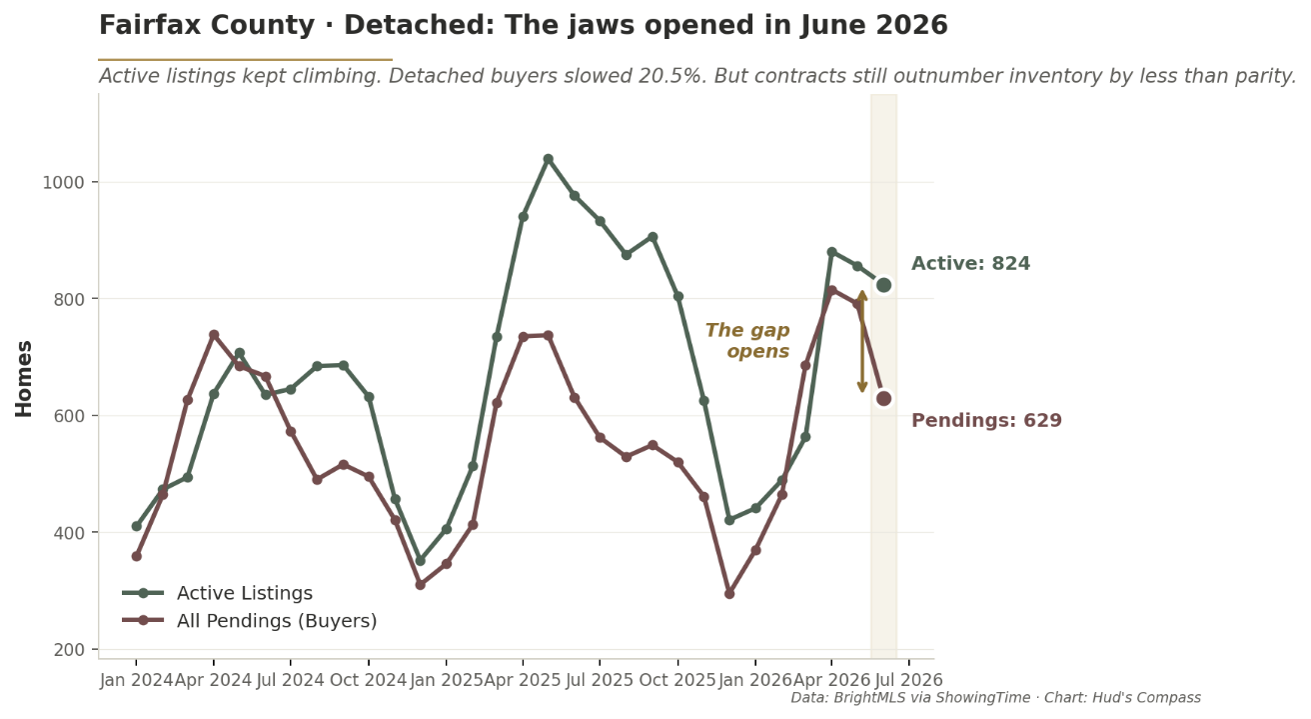
Detached pendings dropped 20.5% month over month — 792 in May, 629 in June. But active inventory fell 3.7% at the same time. Both lines moved down together, which is why the Contract Ratio only slipped to 0.76 and stayed the strongest in the county.
That convergence is what a tight lane looks like under pressure. Demand cooled and supply cooled with it, so listings never piled up. Sellers who priced right were still clearing in the first week on market.
Hud’s Compass scored Detached at 74.4 Overall — the highest of the three structures, with buyers negotiating harder on terms than on price.
If you own a well-prepped detached home and priced to today’s floor, the June buyer still purchased it.
Townhomes — the shocker.
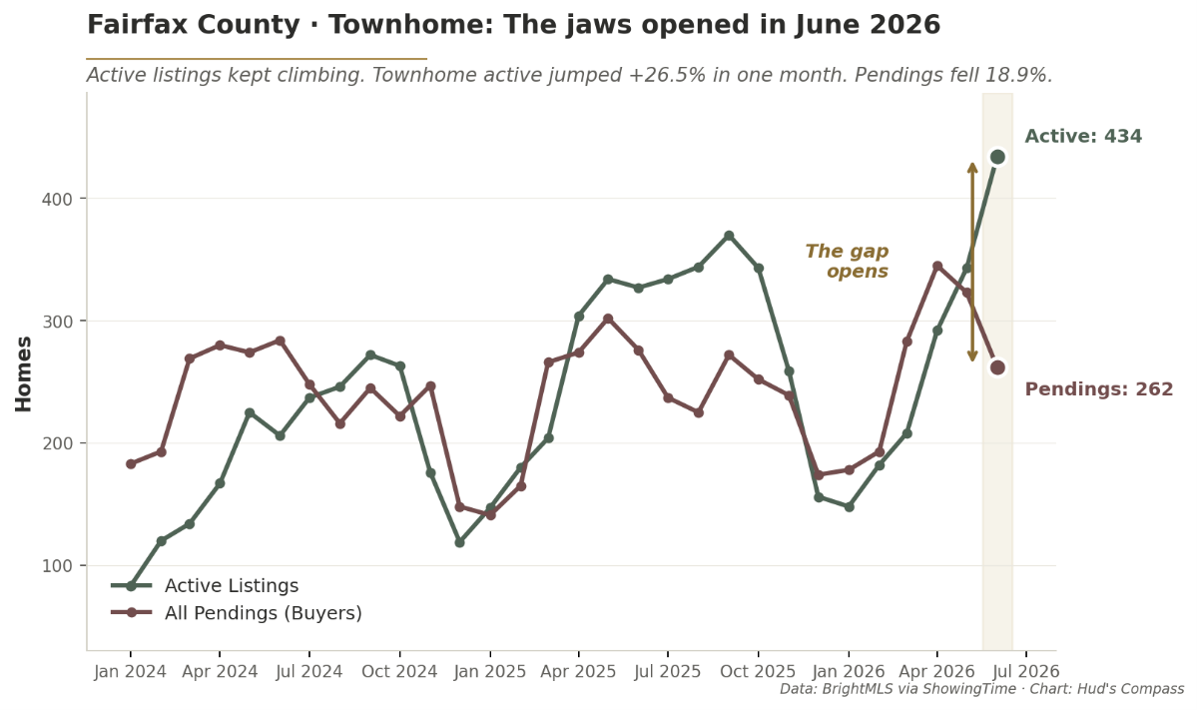
Active townhome listings went from 343 in May to 434 in June. A 26.5% surge in four weeks — the largest inventory shift of any structure in the county. Pendings fell 18.9% at the same time. The Contract Ratio dropped from 0.94 to 0.60.
That’s a market rebalancing in one month. Sellers listed for the spring buyer; the June buyer had already turned toward vacation.
The townhome inventory that landed in June is aging in real time, and it’s all competing for the same buyer — cash-tight, condition-sensitive, no budget for projects after closing.
Sellers listing in July who price at May’s ceiling will sit through August.
Condominiums — the flat line is the story.
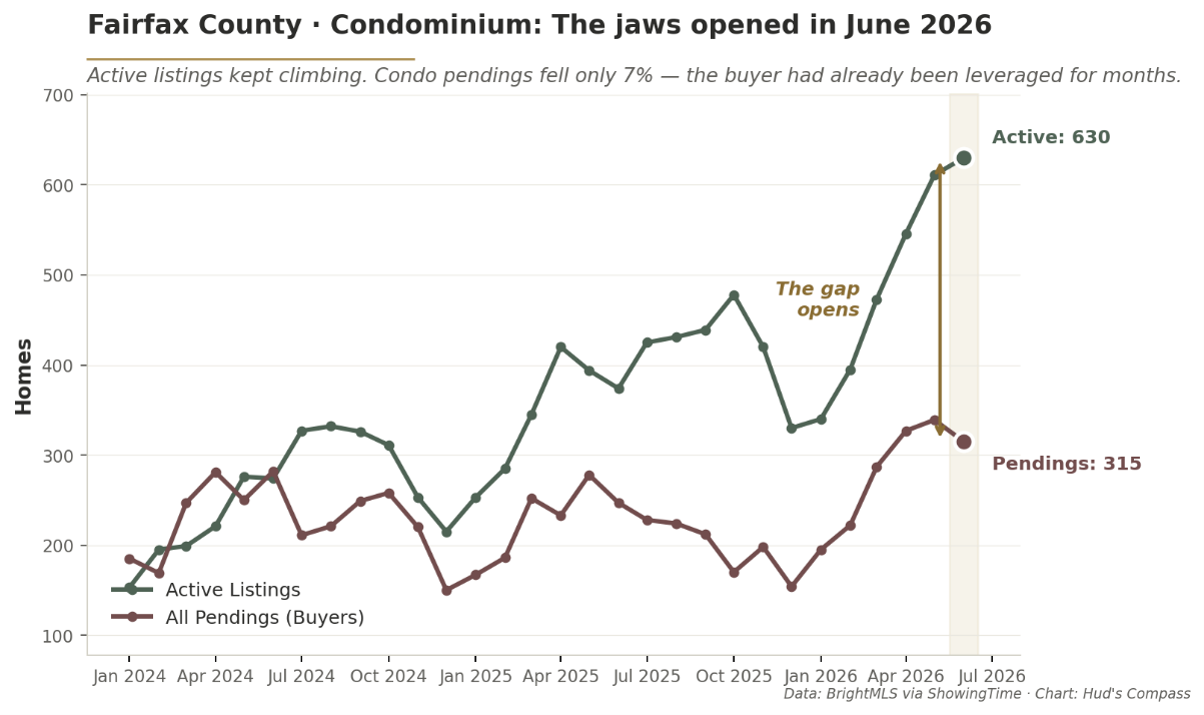
Nothing dramatic happened to condos in June, and that’s precisely the point. Active listings have hovered around 600 all spring. Pendings never crossed above active. The Contract Ratio has been under 0.60 for months and now sits at 0.50 — one contract for every two listings.
Condominium buyers have held the leverage since early spring. June didn’t change that; it just extended it.
Rate math plus monthly HOA math compresses exactly how far a first-time buyer will stretch, and there’s no room left in that calculation. Hud’s Compass shows condo sellers carrying the highest pricing discipline of the three structures — they reset expectations earlier because their market turned earlier.
Disciplined sellers are still closing; everyone else is watching their listing age.
For sellers
Price to today’s floor, not last month’s ceiling.
May’s Fairfax County Detached median was $1,055,000. June’s was $1,005,000. A $50,000 step-down in four weeks — and that’s a shift in what sold, not a market crash. But if you price to May and the June buyer is comparing you to June, you’re the expensive listing.
Hud’s Compass scores four behavioral indexes monthly from closed-sale data — Power, Velocity, Intensity, Strategy. Strategy dropped 6 points across all three structures simultaneously in June. Detached, Townhome, Condominium — synchronized. That’s the county-wide signal that seller pricing is out of step with the market that’s actually buying.
Then check your structure, because the county average is hiding your reality. Listing a townhome? You’re competing against 26% more inventory than existed in May. Listing a condo? You’ve been in a buyer’s market since spring — you already knew that. Listing detached? Buyers are still writing offers, but only on the right ones.
Well-prepped, correctly-priced homes still cleared in about a week at full list price in June. Everything else negotiated on terms, and a meaningful share ended with a concession check written at settlement.
Your only lever now is condition. Not price. Not marketing photos. Not agent-of-the-month awards. Condition. Well-prepped, correctly-priced homes still cleared in about a week at full list price in June. Everything else negotiated on terms, and a meaningful share ended with a concession check written at settlement.
Price is what gets you looked at. Condition is what gets you closed.
For buyers
You hold real leverage for the first time in the calendar year — but not evenly across every structure.
Buying detached? Competition thinned but didn’t vanish. Contract Ratio 0.76 means well-prepped homes are still moving fast. Bring your strongest offer on those, and walk away from the seller still pricing for May. Where you have room is terms, not price.
Buying a townhome? This is where the door opened. Active inventory up 26.5% in a single month and the Contract Ratio at 0.60. You have options you didn’t have four weeks ago. Take your time. Ask for things.
Buying a condominium? Two homes on the market for every buyer writing a contract. You’ve had this leverage for months and June widened it. Ask for concessions, ask for repairs, and ask for a price that makes honest sense.
That math matters for your offer. Pay May’s premium in a June market and you may spend five years earning back the difference. Offer at June’s level, let the appraisal set your ceiling, and you’re buying an asset instead of inheriting an anchor.
Hud’s Compass shows the strongest cumulative equity in Detached homes — +40% cumulative appreciation since 2020. That equity is real — it isn’t a bubble waiting to pop. But the pace has normalized. Compounding that used to arrive in eighteen months now takes years.
If you offer at May’s premium, you may spend the next five years earning back the difference. If you offer at June’s plateau — and let the appraisal set the ceiling — you buy an asset.
If you chase price, you inherit a debt anchor.
What’s next
July is the quietest buyer month of the year in Fairfax County. Correctly-priced homes will still close; overpriced homes will sit into August. Then the market goes quiet until the pre-spring setup begins in January.
If you have flexibility between December and March, that’s a materially fresher buyer pool than the one you’d list into next week. Sellers who need to move in July: price to condition, not to headlines.
Sellers: Watch for the September Annual School Planning Compass and Guide.
Buyers: Watch for the October Annual Buy vs. Rent Planning Compass and Guide.
The annual school bell rang right on schedule. It always does.
The full read — 7 pages of Hud’s Compass analysis on Fairfax County — embedded above.
Individual city reads for Reston, Herndon — Vienna, McLean, Fairfax, Falls Church, Oakton, and Great Falls Coming Soon.
All Fairfax County Hud’s Compass Reports Accessible by Clicking Here!
If you want a personalized Compass Analysis applied to your home — reach out anytime. It is never too early to start planning — take it from someone who knows, a fellow planner who is deep in the numbers weekly.
Michele Hudnall
Real Estate of Northern Virginia | Equity-First Real Estate Strategy
Hud’s Compass · Northern Virginia’s Market Intelligence
[email protected] | 703.867.3436
RealEstateofNVA.com | @realestateofnva
I help Northern Virginia buyers and sellers make smarter decisions with local market analysis, strategic guidance, and real-world context, not hype headlines.
Disclosure: Michele Hudnall is a licensed real estate agent in Virginia. This post represents her personal analysis and good-faith opinion as a Northern Virginia real estate strategist and does not constitute legal or financial advice. Full disclosure at RealEstateofNVA.com. All analysis and opinion are my own and based upon local, real-time data. Please consult with a financial or legal professional as required.
Privacy Statement | Disclosure Notice
About the data: Sales data from BrightMLS. Mortgage rates from Freddie Mac (FRED series MORTGAGE30US). Compass behavioral scoring methodology from Michele Hudnall’s proprietary intelligence.