

Fairfax ran at two speeds this fall: the homes that sold went fast and near full ask, while demand per unit of supply drained to records beneath them. What sells, sells well — far less is selling.
Data Source: BrightMLS (closed sales & inventory) · Freddie Mac (mortgage rates) · Hud’s Compass proprietary behavioral market intelligence.
Fairfax is the corridor’s balanced family-move market — a full spread of detached, townhome, and condo at mid-corridor prices, the kind of town where a move-up buyer trades one structure for the next. That balance is exactly why September split so cleanly: the detached homes that cleared still commanded full ask, while the attached tiers ran out of buyers.
Thirty-year mortgage rates opened 2026 near 6.1%, held around 6.5% through spring, drifted to 6.6% into the fall, then ran from 6.7% to 7.3% inside September. Fairfax ran at two speeds: what sold, sold well — detached still cleared at full list in about nine days — but demand per unit of supply fell to an eleven-year low in townhomes and condo closings hit a record low. The price held; the terms gave.
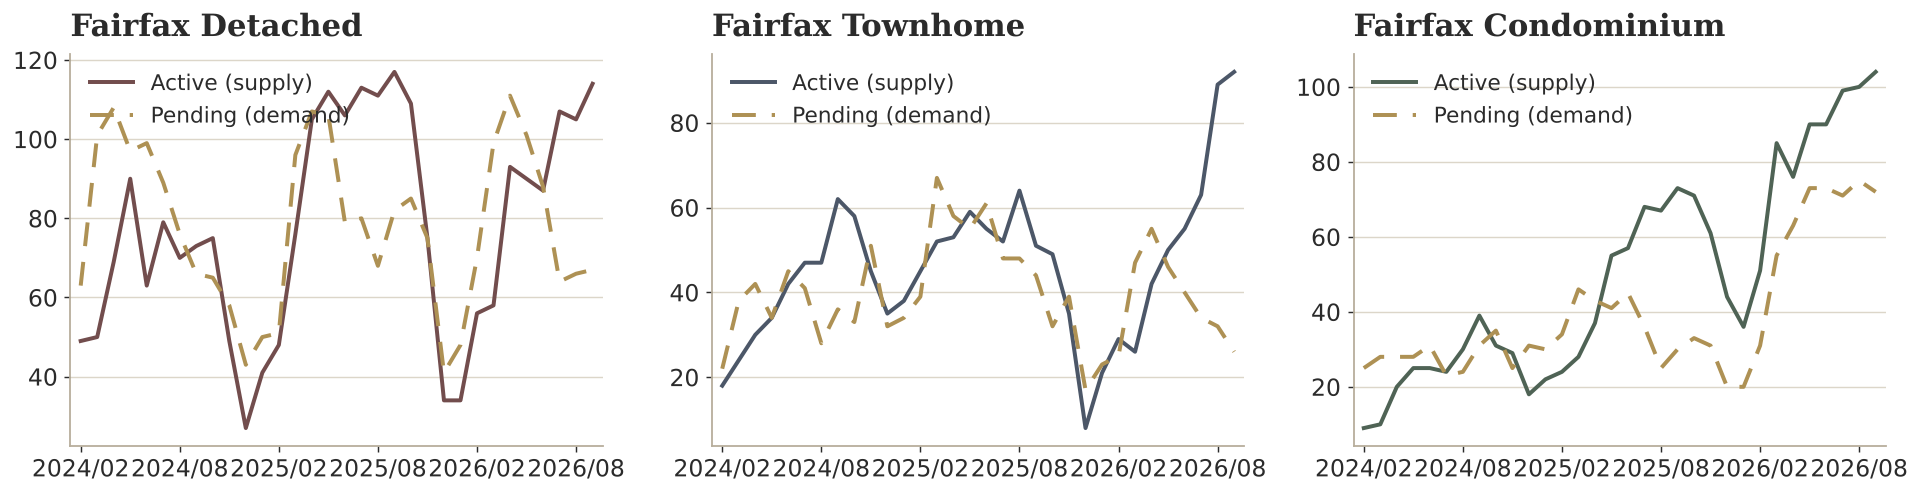
Fairfax supply (active) vs. demand (pending) by structure, September 2026. Source: BrightMLS.
The force this month was demand draining out from under steady prices. The townhome contract ratio fell to 0.283 — the lowest September in the eleven-year record, demand per unit of supply down 67% in a year — while active inventory jumped 80% to a record. Condo closings fell to a record low even as inventory hit a record high. And across all three tiers, sellers kept the sign price and gave at the table: concessions ran to multi-year highs, 27% of detached sales, 39% of townhome, 42% of condo.
In Fairfax, the homes that sold, sold well.
Far fewer sold — and those sellers paid at the table.
WHAT SOLD, SOLD WELL — FAR LESS SOLD
The clearest demand gauge is the contract ratio — pending sales divided by active listings. Above 1.0 is a seller’s market; below it, supply outruns demand.
The townhome ratio fell to 0.283, the lowest September on record, and detached eased to 0.588. The condo ratio reads higher at 0.692 — but that is a delivering building pre-selling (72 pendings against just 19 closings), not a healthy resale market. The honest condo signals are its record-low closings and record-high inventory.
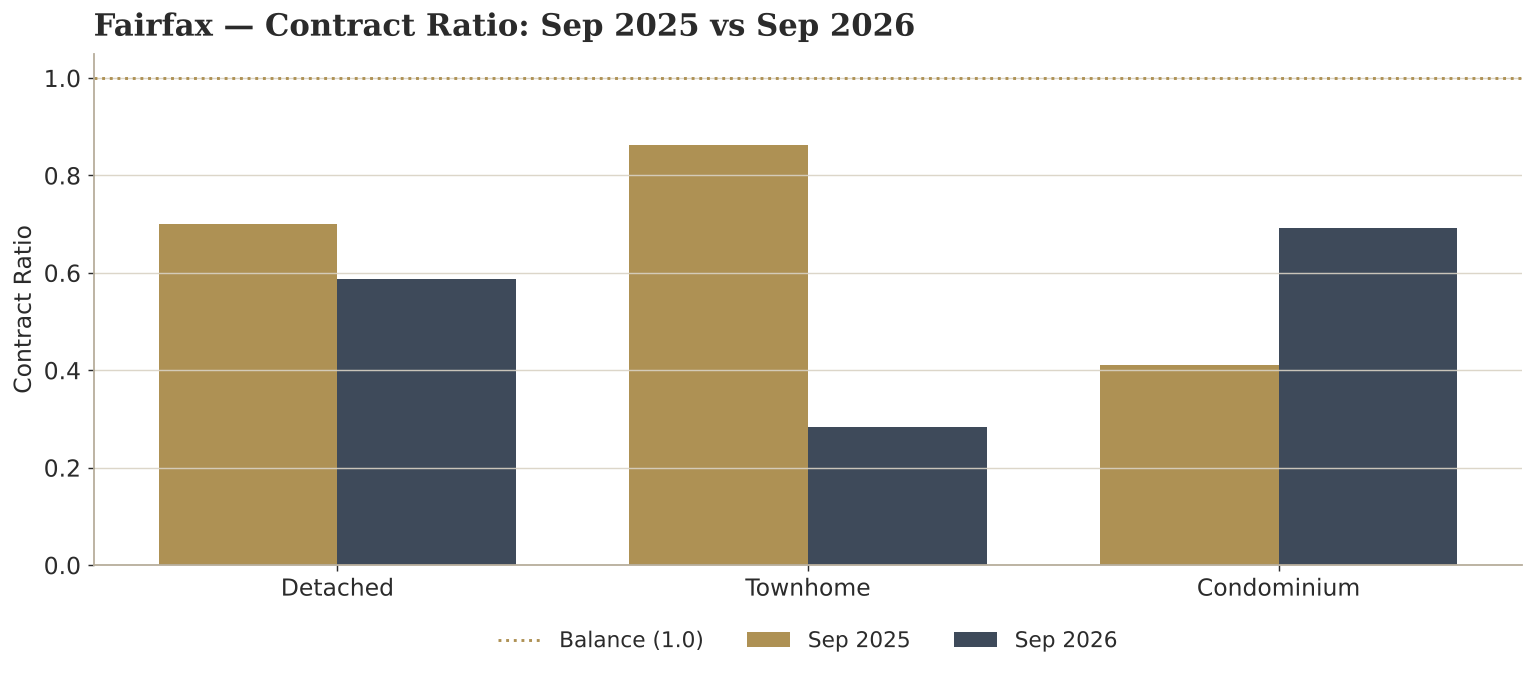
Fairfax Contract Ratio by structure, a year ago vs. now. Gold line = balance (1.0). Source: BrightMLS.
Read the ratios with care: detached and townhome demand genuinely thinned, while the condo figure is propped up by pre-sales at one project — the tier is weaker than its ratio suggests.
HUDS COMPASS
NORTHERN VIRGINIA’S
ONLY MARKET INTELLIGENCE INDEX
Conditions data tells you what is coming — supply, demand, the direction of pressure. Anyone with an MLS login can pull it. The Compass tells you why — it reads the behavior behind the closings, scoring four needles from every closed sale. And the read tells you how to act. This month’s Fairfax report reads the closed side: the homes that sold cleared at full ask while demand drained to records and sellers gave at the table.
One teaching point unlocks the rest. Most people watch sale-to-list price — but a list price is just an asking number a seller can type at will. Watch sale-to-assessed instead: the county’s assessed value is a fixed anchor that doesn’t move with a seller’s optimism. When a home clears above assessed with no concession, real demand paid up. When it holds its list price but closes with money back at the table, the asking number was a wish the terms quietly corrected.
Detached — still clears at full ask
Detached held its value and its speed. The resale median is about $996,000 for the year, up 2.2% and 2.9% per square foot, and the homes that sold cleared at full list in about nine days. One September print read down 6.3% year over year, but on a +2.2% year that is a single soft month, not a trend.
The softening is underneath the price: the contract ratio eased to 0.588, and 27% of sellers paid a concession, up from a year ago. The value and the speed held; the leverage at the table shifted.
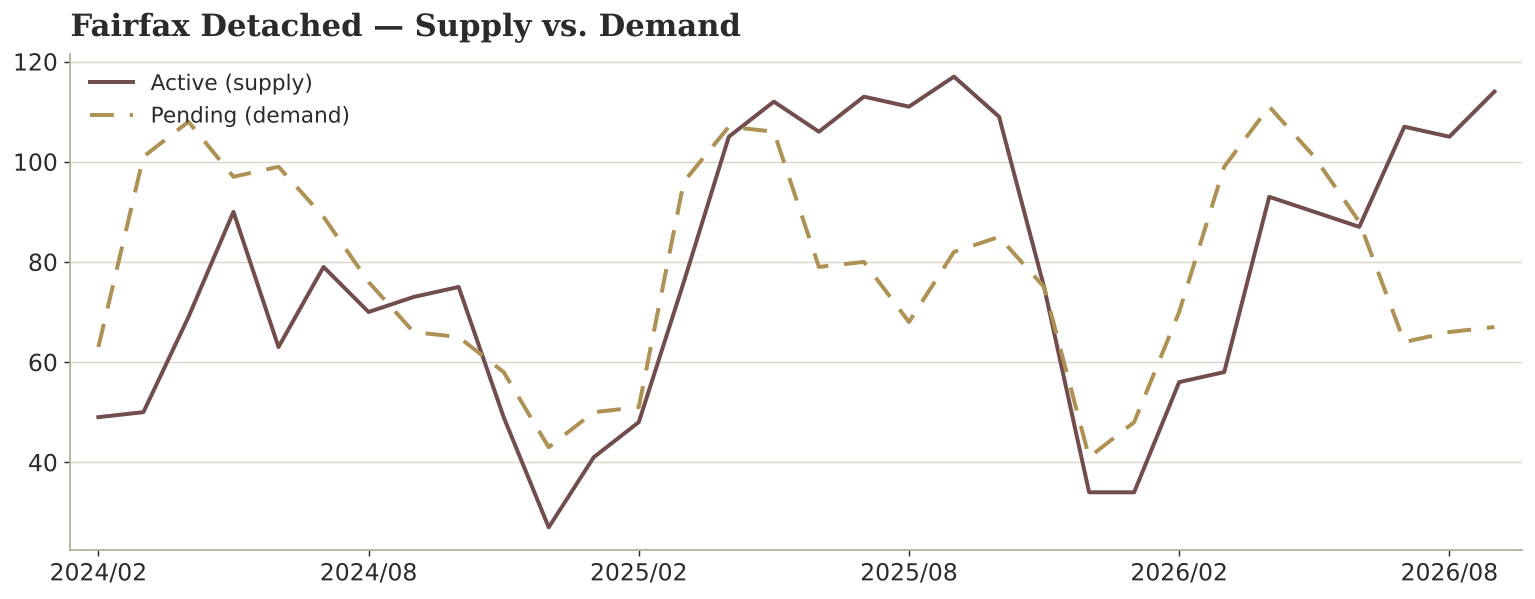
Fairfax detached supply vs. demand, September 2026. Source: BrightMLS.
The detached homes that sold, sold well — full ask in about a week. Fewer sold, and the table gave.
Townhome — ran out of buyers
The townhome tier is where demand collapsed. The contract ratio fell to 0.283, the lowest September in the eleven-year record — down 67% in a single year — as active inventory jumped 80% to a record 92 and months of supply hit a record 2.08. The resale median still held, up 2.3% for the year to about $715,000.
The pressure showed up in the terms: 38.9% of September townhome sellers paid a buyer concession, the highest rate in the seven-year record, up from 19.0% a year ago. The sign price held; the discount moved to closing.
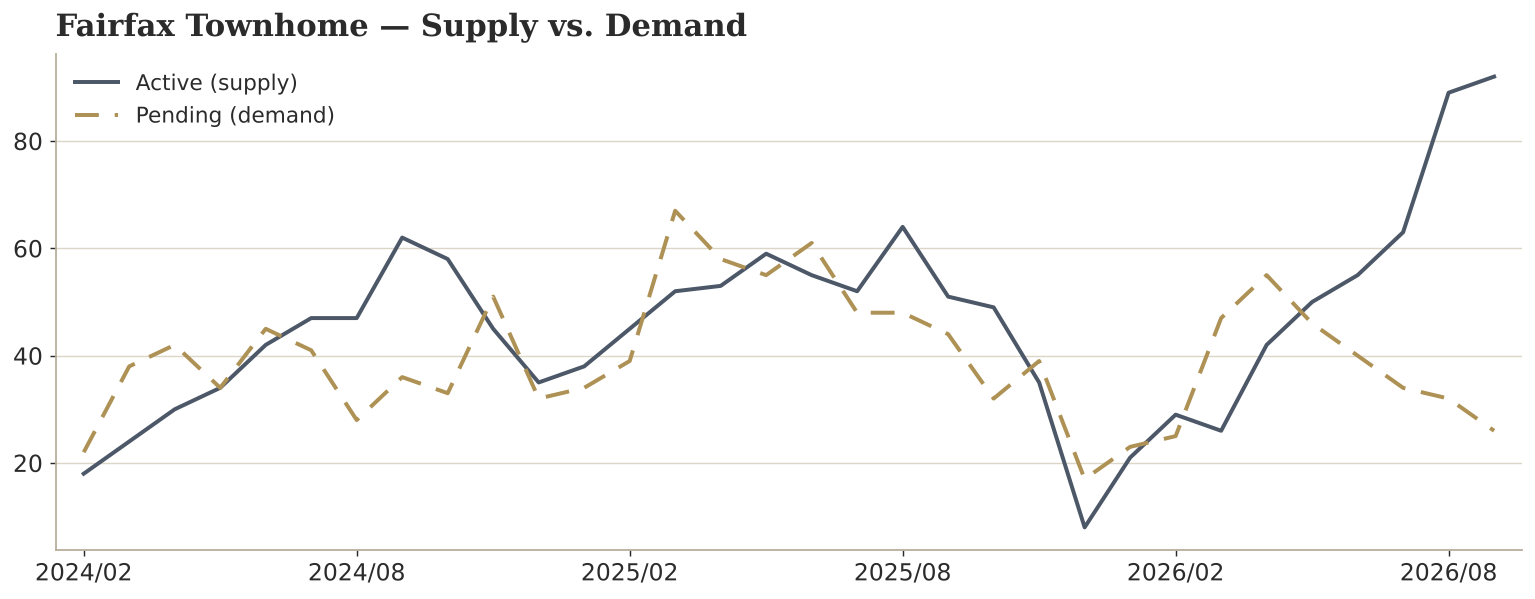
Fairfax townhome supply vs. demand, September 2026. Source: BrightMLS.
A record of listings met the thinnest demand on record — the price held, the table gave.
Condominium — record inventory, record-low sales
The condo tier nearly stalled. Active inventory hit an eleven-year high of 104 while closings fell to a record-low 19, pushing months of supply to a record 4.22. The contract ratio reads 0.692, but that is a delivering building’s pre-sales, not broad demand.
On value, the median is up about 1% for the year to roughly $400,000 — but price per square foot is down 4.9%, so the median flatters a softening tier. And 42% of condo sellers paid a concession, up sharply from a year ago.
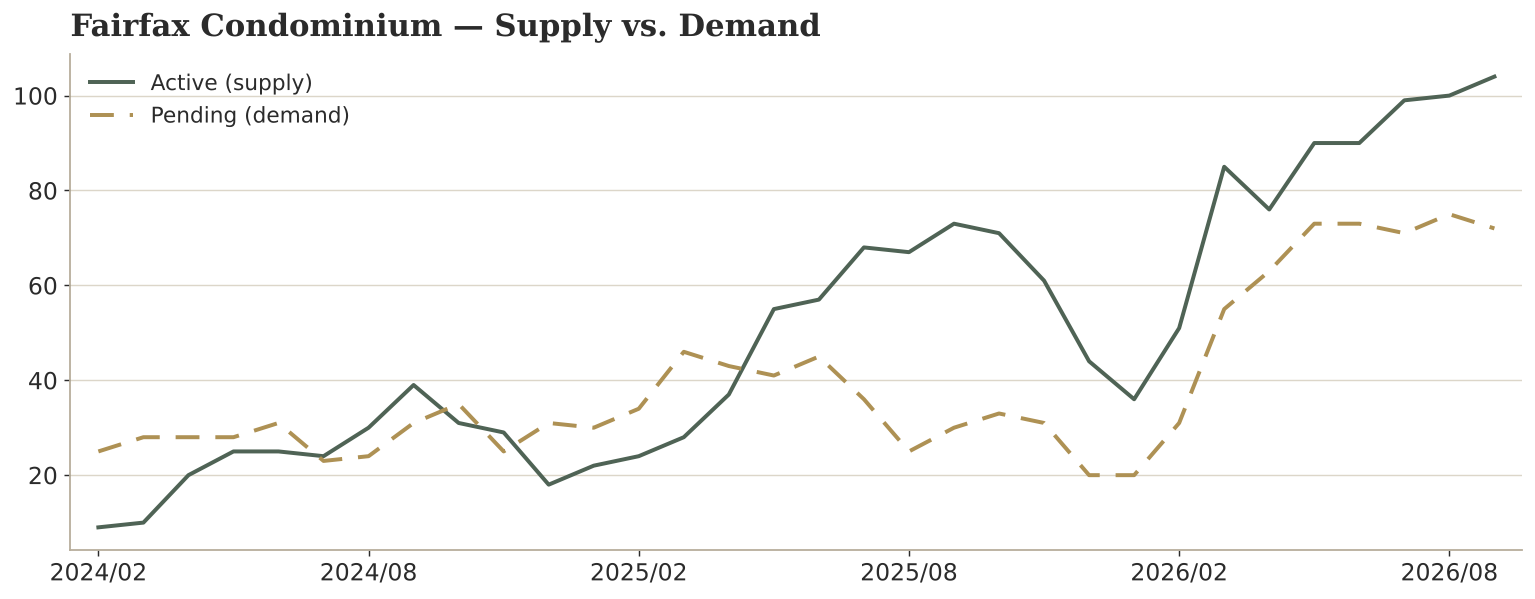
Fairfax condominium supply vs. demand, September 2026. Source: BrightMLS.
A record of listings, the fewest sales on record, and nearly half of sellers paying at the table — the condo tier is the softest in town.
FOR SELLERS
Price to today’s demand, and plan to compete on terms.
DETACHED: Your value and speed are intact if the home shows well — price to list, expect a quick clear, and budget a modest concession.
TOWNHOME: You are listing into record inventory and record-low demand. Build the concession in from the start, and consider a rate buydown over a price cut.
CONDOMINIUM: The softest tier in town — price sharply, lead on terms, and expect time on market; nearly half of sellers are paying a concession.
FOR BUYERS
This is the most room attached buyers have had in Fairfax in years.
DETACHED: Still the firmest tier — compete on price where you must, then ask for help at settlement, because sellers are already giving it.
TOWNHOME: Record inventory, record-low demand, a flat sign price — ask for the concession; nearly 4 in 10 sellers are paying one.
CONDOMINIUM: The most leverage in town — months of supply at a record and 42% of sellers paying concessions. Watch sale-to-assessed, not just sale-to-list.
And the rate math: a seller-paid buydown at 7.3% beats an equal price cut on your monthly payment — and if rates ease, you refinance and keep the home you bought on soft terms.
WHAT’S NEXT
Fairfax is the corridor’s two-speed market — strong sales on thin volume, demand draining underneath.
CONTRACT RATIO — the demand gauge — fell to an eleven-year low in townhomes and eased in detached, while the condo figure was distorted by a delivering building.
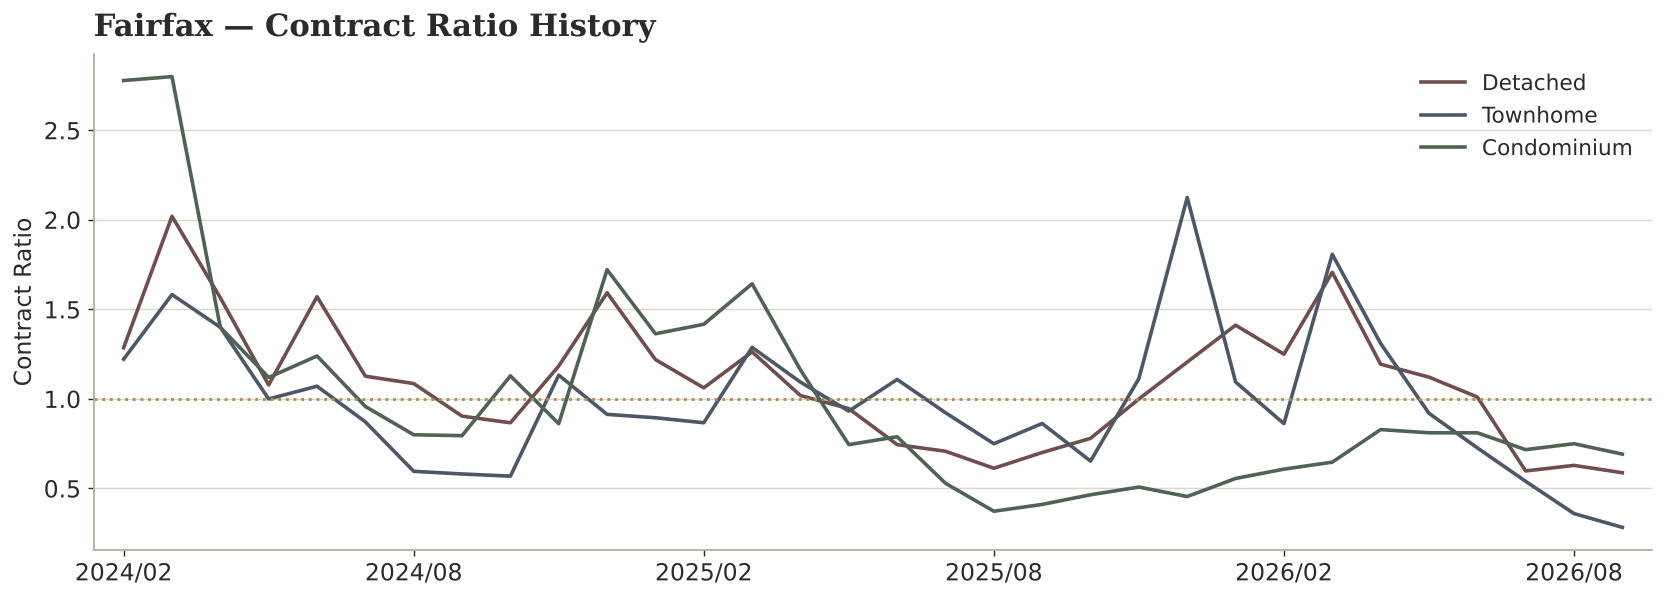
Fairfax Contract Ratio history by structure. Gold line = balance. Source: BrightMLS.
MONTHS OF SUPPLY — the supply gauge — climbed to records in townhomes (2.08) and condos (4.22) as inventory surged and sales thinned.
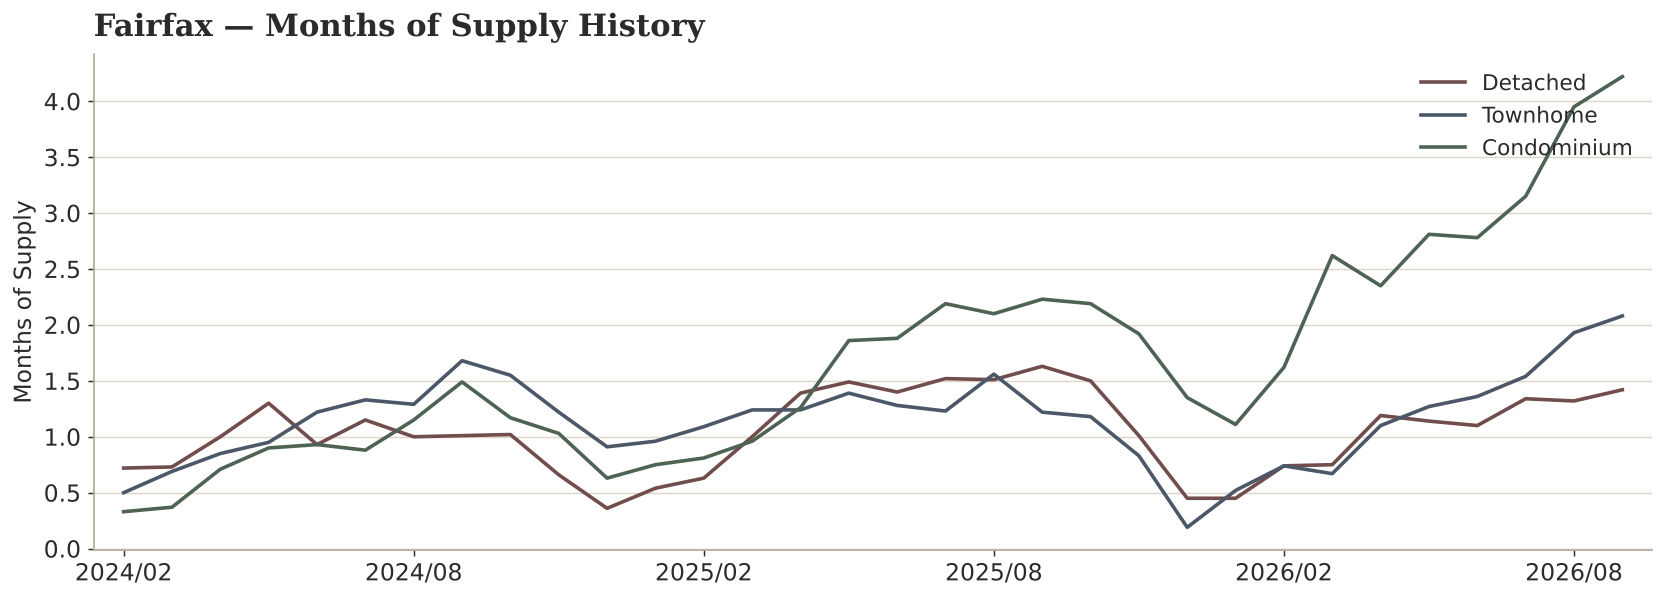
Fairfax Months of Supply history by structure. Source: BrightMLS.
So how much did prices move this year? Not much — which is the point. Detached and townhome resale values held near +2%, and the condo median read up 1% (though it is down per square foot, so the median flatters it). Values held across the board; what changed was demand and terms, not price.
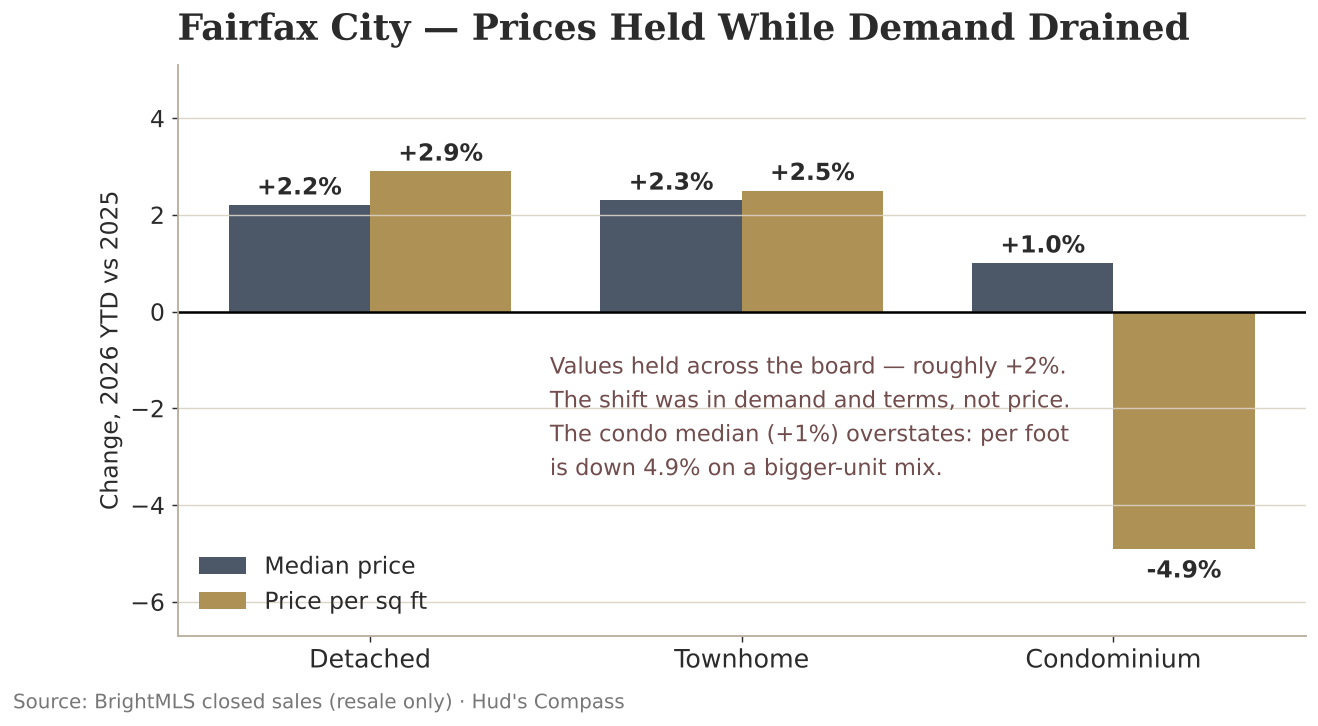
Fairfax resale price change by structure, 2026 YTD – median vs. price per square foot. Source: BrightMLS.
In Fairfax this September, the market ran at two speeds. What sold, sold well — but far less sold, and the give moved to the table. Read your tier, then read the terms.
COMMON QUESTIONS
Are Fairfax home prices going down? Mostly no. Detached and townhome resale values are up about 2% for the year, and the condo median is up about 1% (though softer per square foot). A single September detached print read down, but the year is up — the real change was demand, not price.
Is Fairfax a buyer’s or seller’s market right now? It is two-speed. The homes that sell still clear fast at full ask, but demand per unit of supply fell to an eleven-year low in townhomes and condo closings hit a record low — so the leverage is shifting to buyers in the attached tiers.
Why are Fairfax condos not selling? Condo inventory hit an eleven-year high while closings fell to a record low, pushing months of supply to 4.22. 42% of sellers paid a buyer concession — the price held, the terms gave.
Are Fairfax townhomes a good buy right now? For a buyer, yes — inventory is up 80% to a record, demand per unit of supply is at an eleven-year low, and nearly 4 in 10 sellers paid a concession, so there is real room to negotiate.
What are seller concessions in Fairfax right now? At multi-year highs across all three structures in September 2026 — about 27% of detached sales, 39% of townhome sales, and 42% of condo sales closed with a seller-paid concession.
How much is a home in Fairfax? The resale detached median is about $996,000 for the year (up 2.2%), townhomes about $715,000, and condos about $400,000.
Want the read on your Fairfax home?
The homes that sell are still clearing well — but demand and terms have shifted underneath. If you want to know what your home is worth and what the terms really look like this fall, let’s talk.
Michele Hudnall
Real Estate of Northern Virginia | Equity-First Real Estate Strategy
Life Long Northern Virginia Native | 25-Year Reston Resident | HOA Board President, Whitney Park East | South Lakes Drive
[email protected] | 703.867.3436 | RealEstateofNVA.com | @realestateofnva
I help Northern Virginia buyers and sellers make smarter decisions with local market analysis, strategic guidance, and real-world context, not hype headlines.
Disclosure: Michele Hudnall is a licensed real estate agent in Virginia. This post represents her personal analysis and good-faith opinion as a Reston resident and does not constitute legal or financial advice. Full disclosure at RealEstateofNVA.com. All analysis and opinion are my own and based upon local, real-time data. Please consult with a financial or legal professional as required.
Privacy Statement | Disclosure Notice
About the data: Sales data from BrightMLS. Mortgage rates from Freddie Mac (FRED series MORTGAGE30US). Compass behavioral scoring methodology from Michele Hudnall’s proprietary intelligence. Price and exit figures exclude new construction; inventory and contract-ratio figures include it.