

Supply is back to 2016 levels, but the demand never came with it. This September the county baseline bent — gently on price, hard on terms — and the attached market led the way down.
Data Source: BrightMLS (closed sales & inventory) · Freddie Mac (mortgage rates) · Hud’s Compass proprietary behavioral market intelligence.
Fairfax County is roughly 438,000 homes, and the mix matters for everything that follows: 45% detached, 24% townhome, just 7% condominium — against 24% apartment. The owned condo tier is the county’s smallest slice, and that is exactly why it turns first and hardest when the cost of money moves.
The cost of money did the quiet work this fall. Thirty-year mortgage rates opened 2026 near 6.1%, held around 6.5% through spring, drifted to 6.6% into the fall — then ran past 7% in September, climbing from 6.7% to 7.3% inside the month. Fairfax County eased on terms this September, not on values — the sign price held near ask while the give moved to the settlement table, and demand per unit of supply fell to an eleven-year low. The whole corridor leaned the same way, but the pressure landed on the attached market.
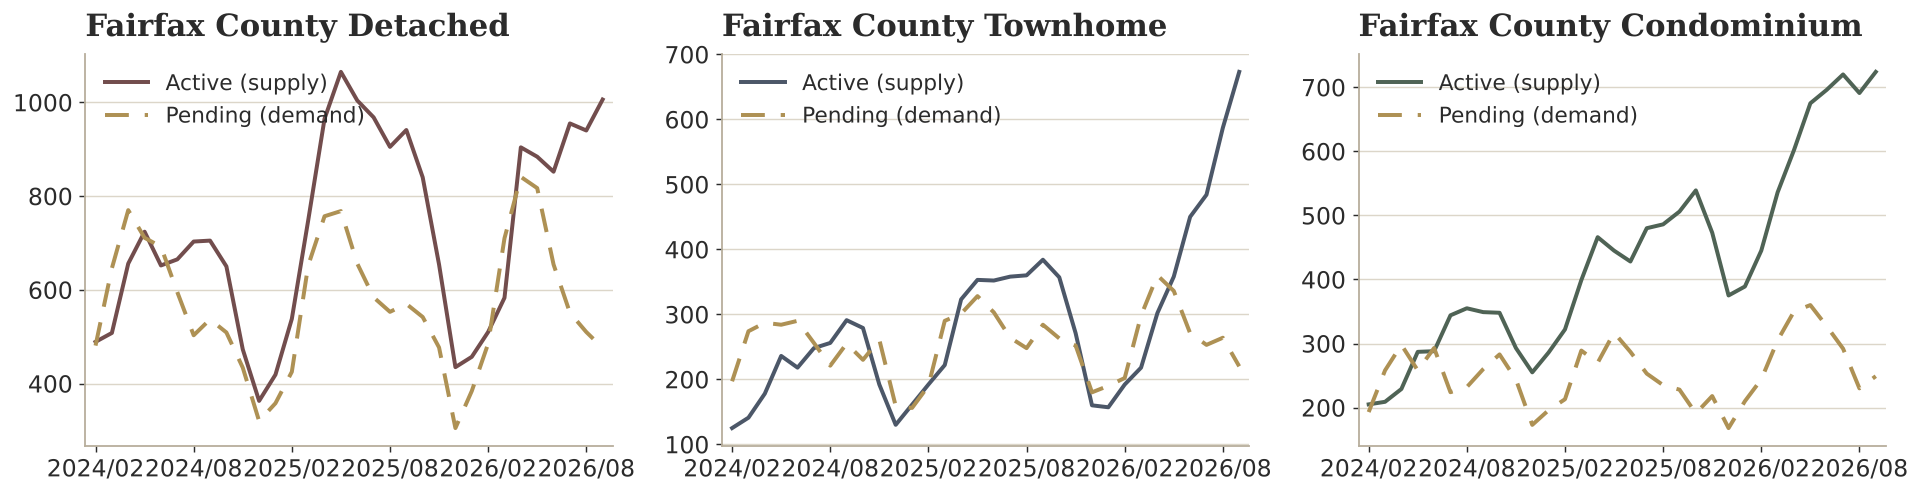
Fairfax County supply (active) vs. demand (pending) by structure, September 2026. Source: BrightMLS.
Here is the finding most headlines will miss: this was not a neighborhood event, it was a structure event. Across the forty county-structure cells deep enough to test against their own history, twenty-one set a record low for demand per unit of supply in the same month — and eleven of thirteen of those were townhome markets. When a single structure type goes soft in eleven different places at once, the cause isn’t local. It’s the cost of money meeting a wave of supply.
One structure, eleven markets, one month.
That’s not a neighborhood story — it’s a rate story.
THE CONTRACT RATIO FELL ACROSS EVERY STRUCTURE
The clearest demand gauge is the contract ratio — pending sales divided by active listings. Above 1.0 is a seller’s market; below it, supply is outrunning demand.
In September it fell across the board, and the townhome drop was the steepest — from 0.74 a year ago to 0.33, an eleven-year low. Supply is back to 2016 levels; absorption is not.
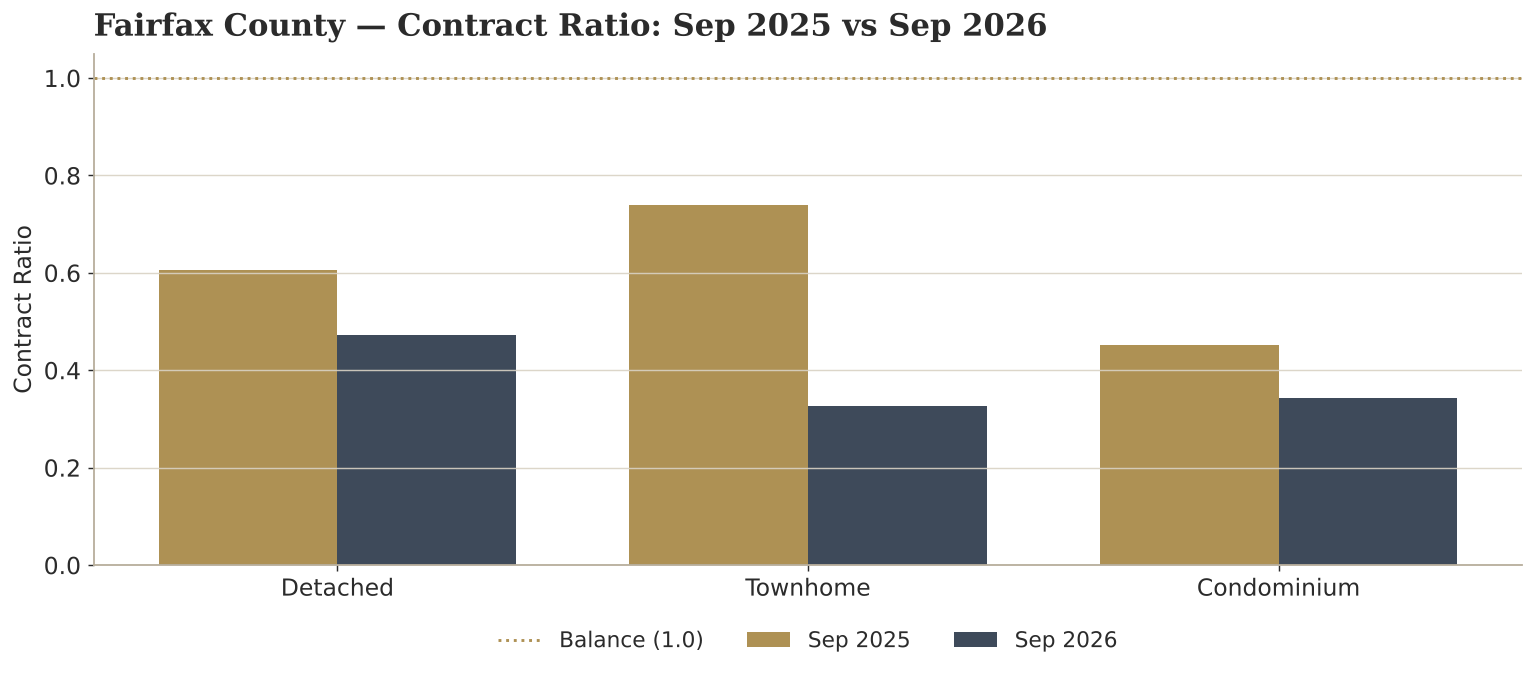
Fairfax County Contract Ratio by structure, a year ago vs. now. Gold line = balance (1.0). Source: BrightMLS.
The split is the story: detached still clears, but the attached tiers — townhome and condo — are where demand thinned to records.
HUDS COMPASS
NORTHERN VIRGINIA’S
ONLY MARKET INTELLIGENCE INDEX
Conditions data tells you what is coming — supply, demand, the direction of pressure. Anyone with an MLS login can pull it. The Compass tells you why — it reads the behavior behind the closings, scoring four needles from every closed sale. And the read tells you how to act. This month’s Fairfax County report reads the closed side: prices barely moved while concessions climbed to seven-year highs — the discount didn’t show up on the sign, it showed up at the table.
One teaching point unlocks the rest. Most people watch sale-to-list price — but a list price is just an asking number a seller can type at will. Watch sale-to-assessed instead: the county’s assessed value is a fixed anchor that doesn’t move with a seller’s optimism. When a home clears above assessed with no concession, real demand paid up. When it holds its list price but closes with money back at the table, the asking number was a wish the terms quietly corrected.
Detached — the premium moved to the table
Detached held the line on price. The typical home sold at 100% of list and cleared in about two weeks — the fastest structure in the county — and the resale median is up 2.6% year to date, firmer still on a price-per-foot basis.
But a fifth of the “supply” is new construction that isn’t built yet, and more than a third of sales now close with a seller concession — a seven-year high. Strip the unbuilt stock and the resale market a buyer can actually move into is tight. The premium didn’t disappear; it moved from the sign to the settlement sheet.
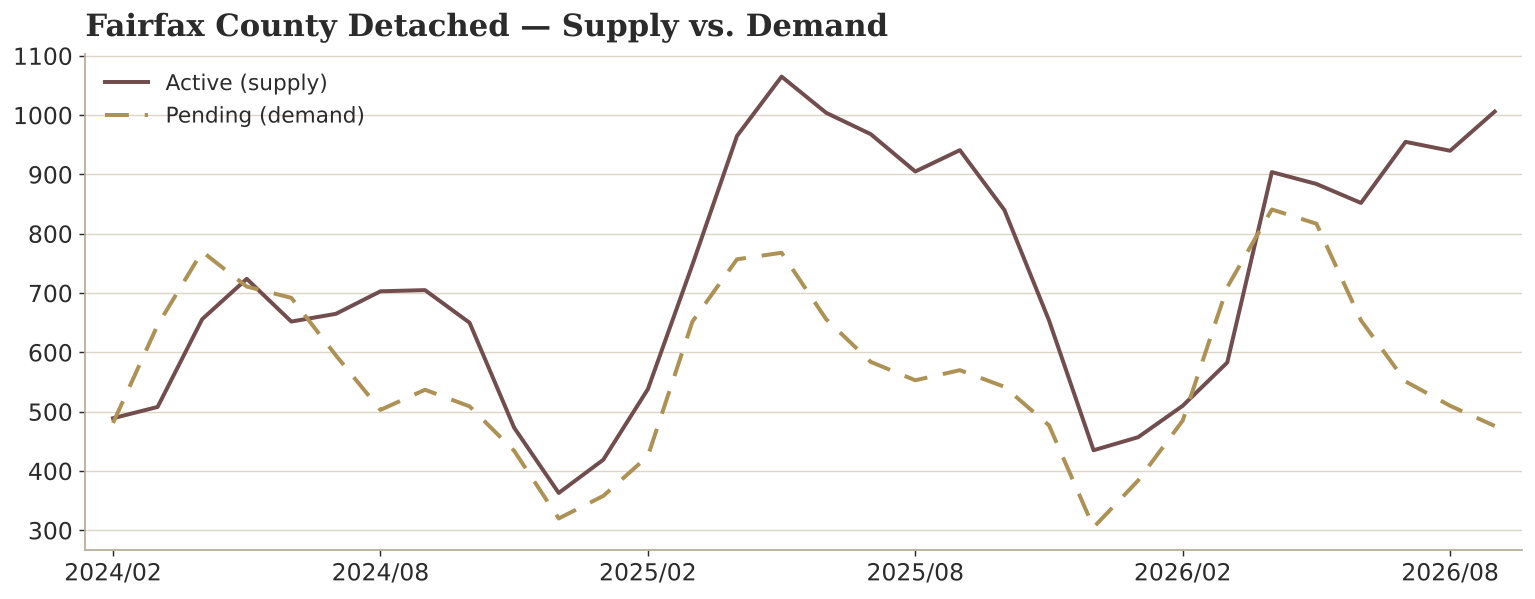
Fairfax County detached supply vs. demand, September 2026. Source: BrightMLS.
The well-shown detached home still clears fast and at ask. The negotiation just moved to closing.
Townhome — priced right, paid at closing
The townhome tier is the county’s deep, affordable middle, and it’s where September softened most. The contract ratio hit an eleven-year low, active inventory climbed sharply, and nearly half of sellers paid a concession — the highest rate of any structure in the seven-year record.
Yet the sign price held near ask and the median is essentially flat for the year. This isn’t a price collapse; it’s a supply wave and a terms shift. For a buyer, it’s the clearest opening in the mid-market in years.
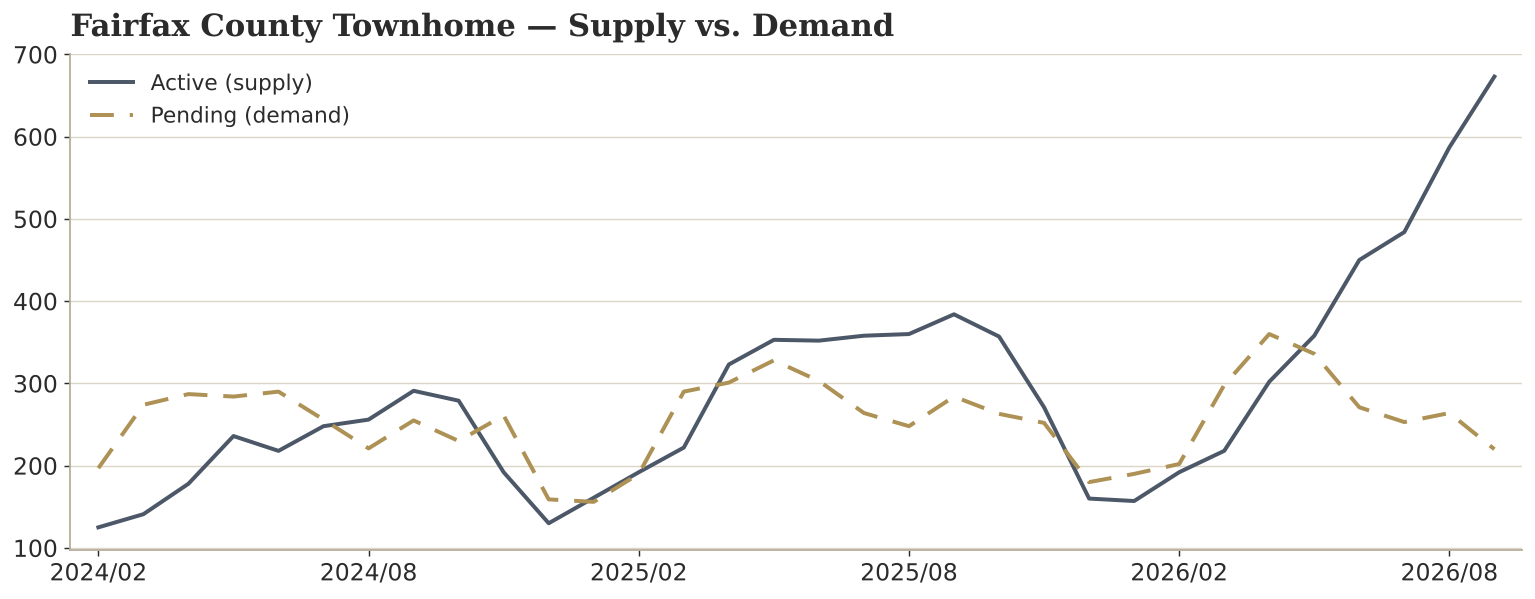
Fairfax County townhome supply vs. demand, September 2026. Source: BrightMLS.
The price held near ask. The leverage moved to the buyer — at the table.
Condominium — the one tier that gave back value
The condo tier is the break. It posted the county’s lowest closing count and highest supply on record, the weakest Power reading in the index, and the county’s only negative price print — down about 5.6% year over year on a resale basis, and that’s not a mix effect.
The entry tier is the one place where the value itself, not just the terms, has turned. Watch it into winter.
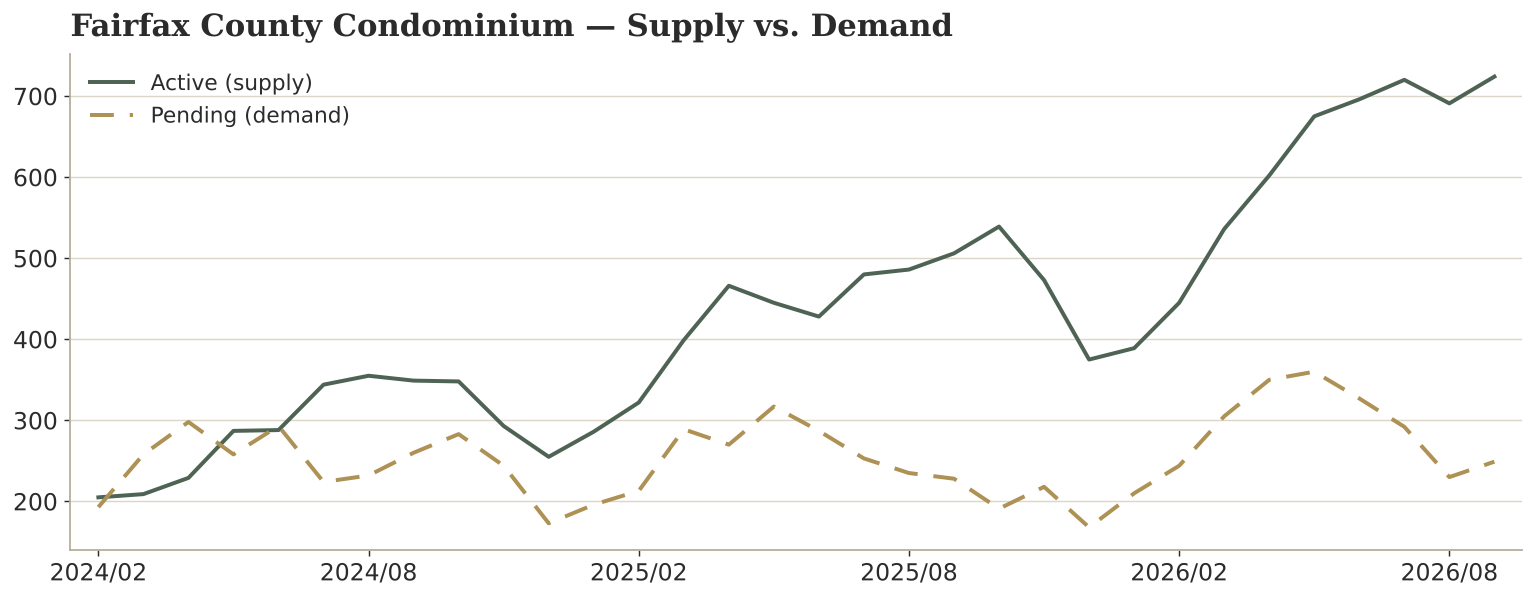
Fairfax County condominium supply vs. demand, September 2026. Source: BrightMLS.
The one tier where the value moved, not just the terms. Buyers have real room here.
FOR SELLERS
One in six Fairfax County listings left the market in September without selling — the softest September this index has measured — and the homes that did sell cleared at their thinnest premium over assessed value in seven years. The ones that withdrew were the ones that waited. Price to today’s market, not last spring’s.
DETACHED: Your equity from the run is intact — you’re negotiating from strength, not fear. Show well and price right; the premium no longer carries a weak listing.
TOWNHOME: Build the concession into your number from the start, and consider leading with a rate buydown over a price cut — it moves a hesitant buyer faster and protects your comp for the neighbor selling next.
CONDOMINIUM: Price to the market as it is, and expect to give at the table. This is the one tier where value, not just terms, has moved.
FOR BUYERS
This is the most leverage buyers have had in years, and it’s concentrated in the attached market.
DETACHED: The sign price is holding, so compete there if you must — then ask for help at settlement, where most sellers are already giving.
TOWNHOME: The clearest opening in the mid-market in years — demand far softer and sellers already paying at closing. Ask for the concession.
CONDOMINIUM: Real room here — the softest tier in the county. Watch sale-to-assessed, not just sale-to-list, to see what buyers are really paying.
And run the rate math: at 7.3%, a $10,000 price cut saves about $65 a month, but that same $10,000 in a seller-paid rate buydown can save far more in the early years — and if rates ease, you refinance and keep the house you bought on today’s softer terms.
WHAT’S NEXT
Supply is back to 2016 levels while demand sits at an eleven-year low per unit — the gap that defines this fall.
CONTRACT RATIO — the demand gauge — fell across every structure this year, with townhomes at an eleven-year low.
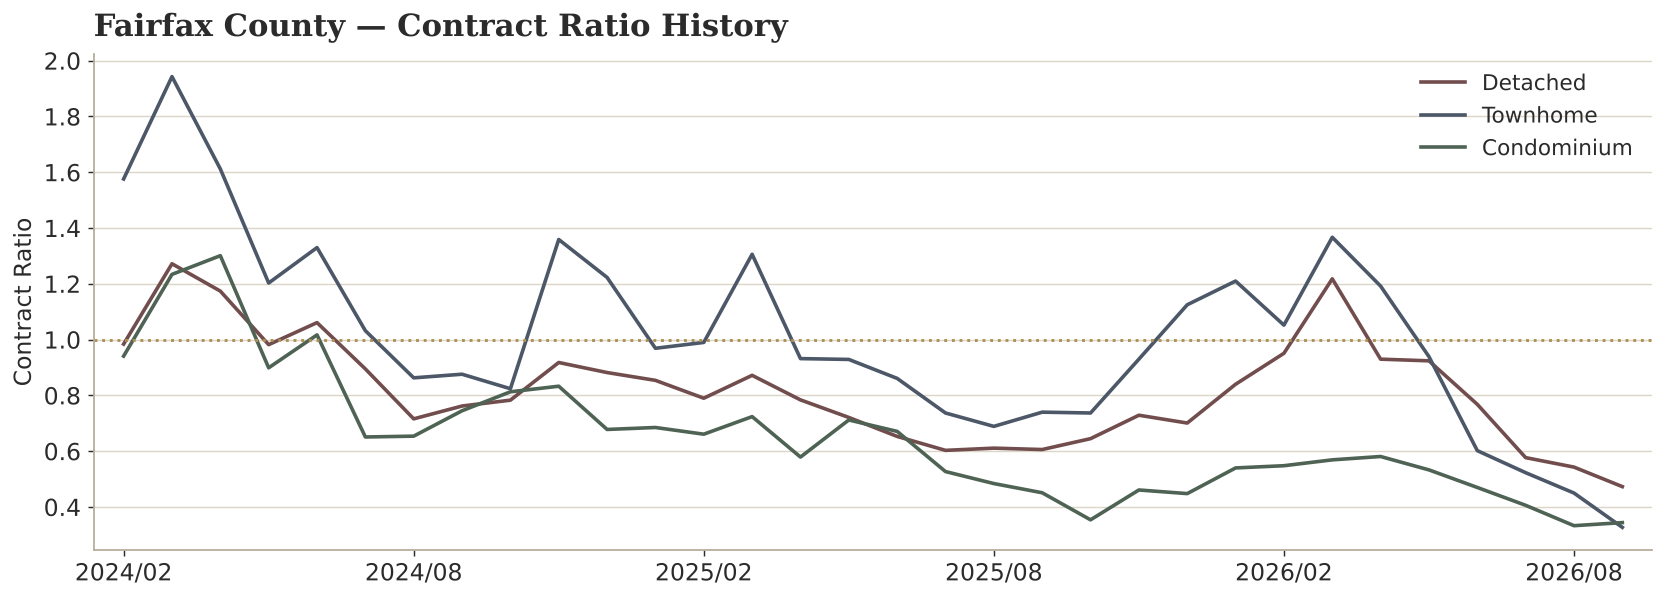
Fairfax County Contract Ratio history by structure. Gold line = balance. Source: BrightMLS.
MONTHS OF SUPPLY — the supply gauge — climbed to multi-year highs, with the condo tier at a record.
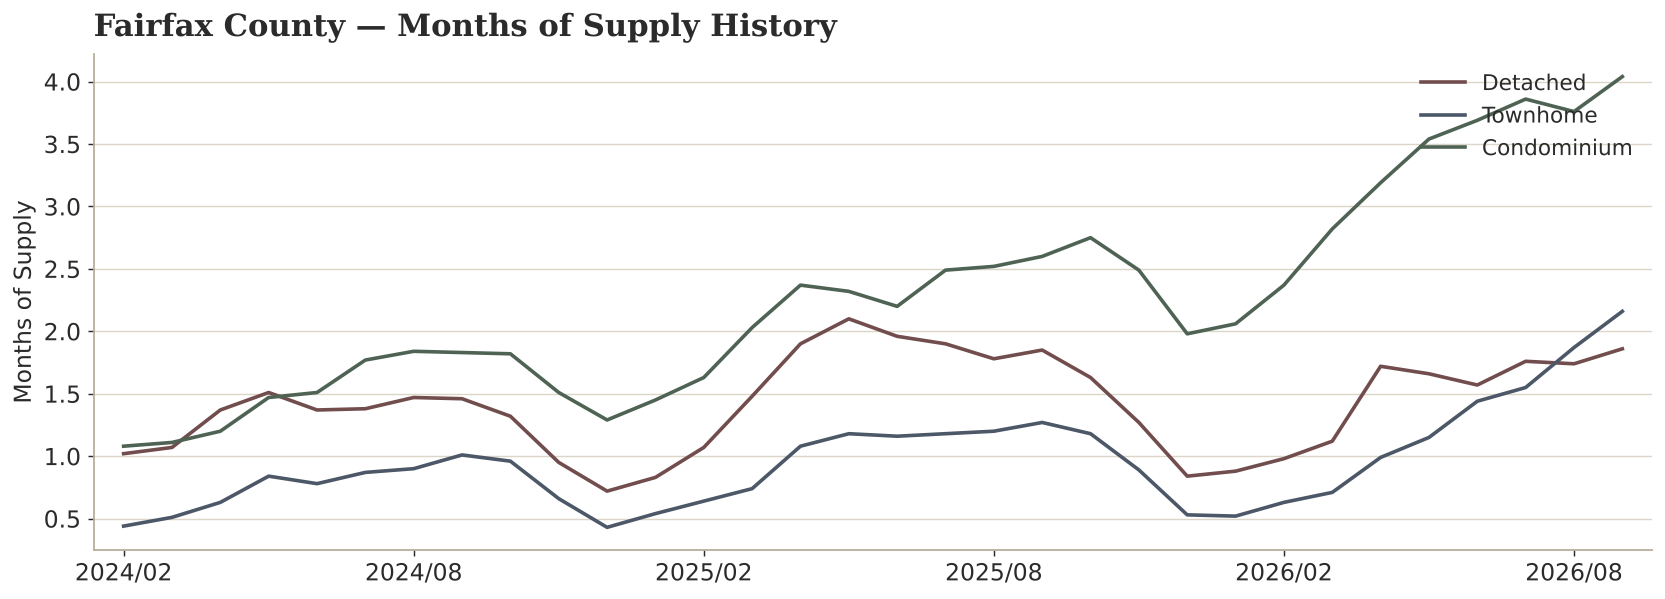
Fairfax County Months of Supply history by structure. Source: BrightMLS.
So what did all that pressure do to prices? Almost nothing — and that’s the point. Year to date the detached median is up just 2.6%, the townhome median is flat, and the condo median is down 2.1%. But watch how the median lies: detached price per square foot is up 4.2% — buyers paying more per foot for less house.
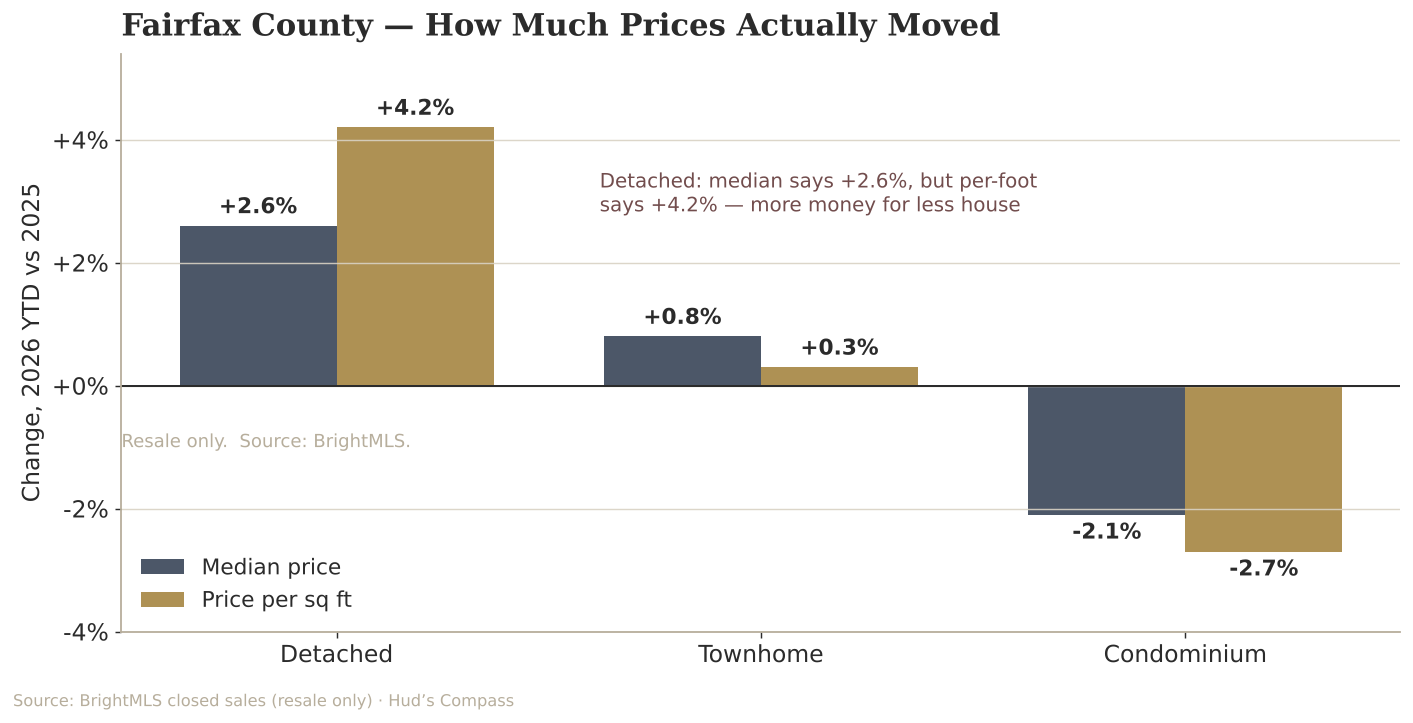
Fairfax County resale price change by structure, 2026 YTD – median vs. price per square foot. Source: BrightMLS.
And the best single read on where the market stands: every structure sold at its thinnest premium over assessed value in seven years — detached about 109%, townhome 105%, condo about 102%, a whisker above the tax figure. That compression is why the concessions showed up — and it tells you February: modest increases for detached, roughly flat for townhomes, and possibly flat-to-lower for condos. The era of the double-digit envelope shock is over.
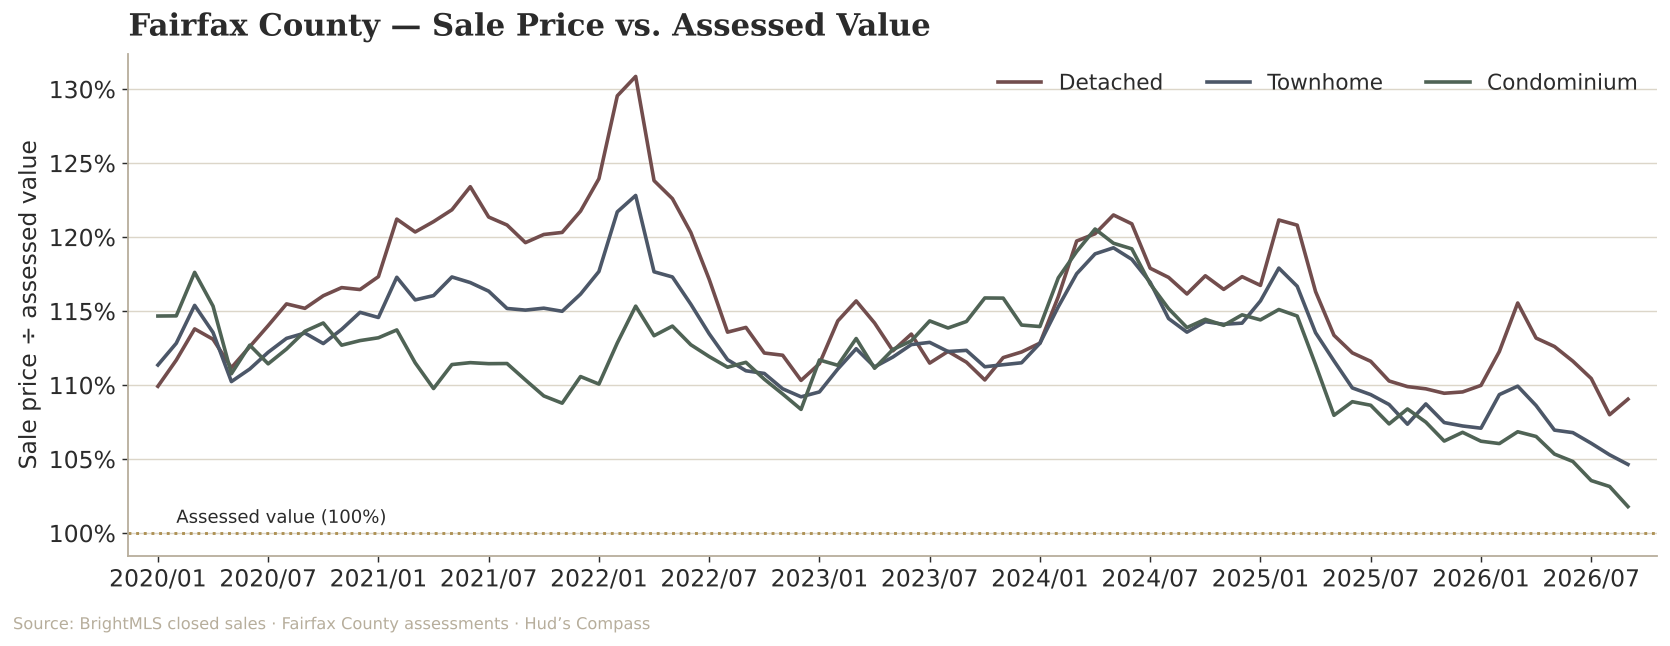
Fairfax County sale price vs. assessed value by structure, 2020-2026. Source: BrightMLS.
The number on the sign held. The give moved to settlement. Read your own market against the county — then read the terms. Each of the fourteen corridor markets has its own full Compass index.
COMMON QUESTIONS
Are Fairfax County home prices going down? Not across the board. In September 2026 detached prices held (up 2.6% year to date) and townhome prices were essentially flat, while condominiums were the exception, down about 5.6% year over year. The real change was in terms, not price.
Is it a buyer’s or seller’s market in Fairfax County? It is shifting toward buyers, especially for townhomes and condos. Demand per unit of supply fell to an eleven-year low in September 2026, and inventory is back to 2016 levels.
What are seller concessions in Fairfax County right now? They hit seven-year highs in September 2026 — about 35% of detached sales, 47% of townhome sales, and 45% of condo sales closed with a seller-paid concession.
How fast are homes selling in Fairfax County? Detached homes were fastest, clearing in about two weeks at full list price. Townhome and condo times stretched as active inventory climbed.
Are Fairfax County condos a good buy right now? The condo tier is the softest in the county — the only structure to lose value, with its resale median down about 5.6% year over year and months of supply at a record high. That gives buyers the most room to negotiate.
Why are prices holding when demand is falling? Sellers are keeping the sign price and giving at the closing table instead, so concessions jumped to seven-year highs while median prices barely moved. Sale-to-assessed value shows the softening the list price hides.
Want the read on your home, not just the county?
Every home has a story the county numbers can’t tell. If you want to know what yours is worth in this market — and what the terms really look like — let’s talk.
Michele Hudnall
Real Estate of Northern Virginia | Equity-First Real Estate Strategy
Life Long Northern Virginia Native | 25-Year Reston Resident | HOA Board President, Whitney Park East | South Lakes Drive
[email protected] | 703.867.3436 | RealEstateofNVA.com | @realestateofnva
I help Northern Virginia buyers and sellers make smarter decisions with local market analysis, strategic guidance, and real-world context, not hype headlines.
Disclosure: Michele Hudnall is a licensed real estate agent in Virginia. This post represents her personal analysis and good-faith opinion as a Reston resident and does not constitute legal or financial advice. Full disclosure at RealEstateofNVA.com. All analysis and opinion are my own and based upon local, real-time data. Please consult with a financial or legal professional as required.
Privacy Statement | Disclosure Notice
About the data: Sales data from BrightMLS. Mortgage rates from Freddie Mac (FRED series MORTGAGE30US). Compass behavioral scoring methodology from Michele Hudnall’s proprietary intelligence.