

Fairfax County is the baseline the fourteen corridor markets are measured against — and this August the whole county eased gently and seasonally, on terms rather than values. Detached gave back its summer premium at the closing table, townhome held the steady middle, and the condo tier was the month’s lone gainer.
Data Source: BrightMLS (closed sales & inventory) · Freddie Mac (mortgage rates) · Hud’s Compass proprietary behavioral market intelligence.
Three numbers set the frame. Mortgage rates held near 6.7% all month — essentially flat from a year ago. Fairfax County’s detached homes carry a median of $947,500; its condominiums, $350,000. On the headline, a steady market holding its value. Underneath, the terms turned across all three tiers at once — which is exactly what the county baseline is built to show you.
Start with supply and demand. Each panel tracks two lines: active listings (homes for sale — supply) against pending sales (homes under contract — demand). When the supply line pulls away from the demand line, the market is loosening in the buyer’s favor. Across Fairfax County this August, active inventory climbed in every tier while demand held — the county building supply beneath a steady market.
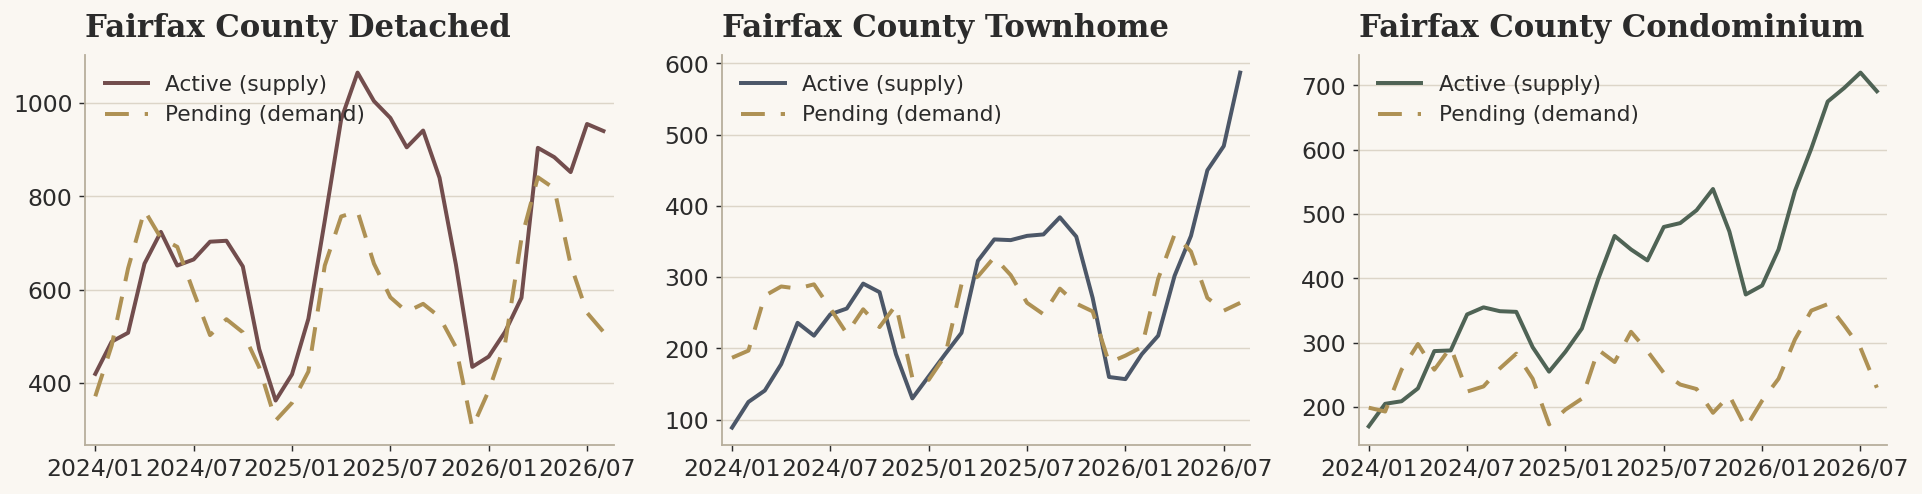
Fairfax County active vs. pending by structure. Source: BrightMLS.
The driver is the seasonal turn, countywide. The corridor runs on a school-year clock — families compete hard through spring, close before the buses roll, then the buyer pool quiets. As summer ended, that handoff pulled the estate buyer back first and hardest, and it showed up across the county’s largest tier and its entry tier at once, while the townhome middle held its ground.
Fairfax County eased on terms, tier by tier — not on whether homes sell.
ONE COUNTY, THREE MARKETS — THE BASELINE FOR FOURTEEN
Here is what makes the county the baseline: this August the Compass scored its three tiers Townhome 69.2, Detached 68.5, Condominium 66.2 — clustered within a few points, the corridor’s most balanced read, yet each tier moving its own way underneath. This is the number every one of the fourteen markets is measured against. Read the county as one, then read your own market against it — because each of the fourteen moved its own way around this average.
The clearest gauge is the Contract Ratio — pending sales divided by active listings. At 1.0, supply and demand balance; below it, inventory piles up faster than buyers absorb it. It turns months before closed prices do, which makes it the earliest honest signal you can get.
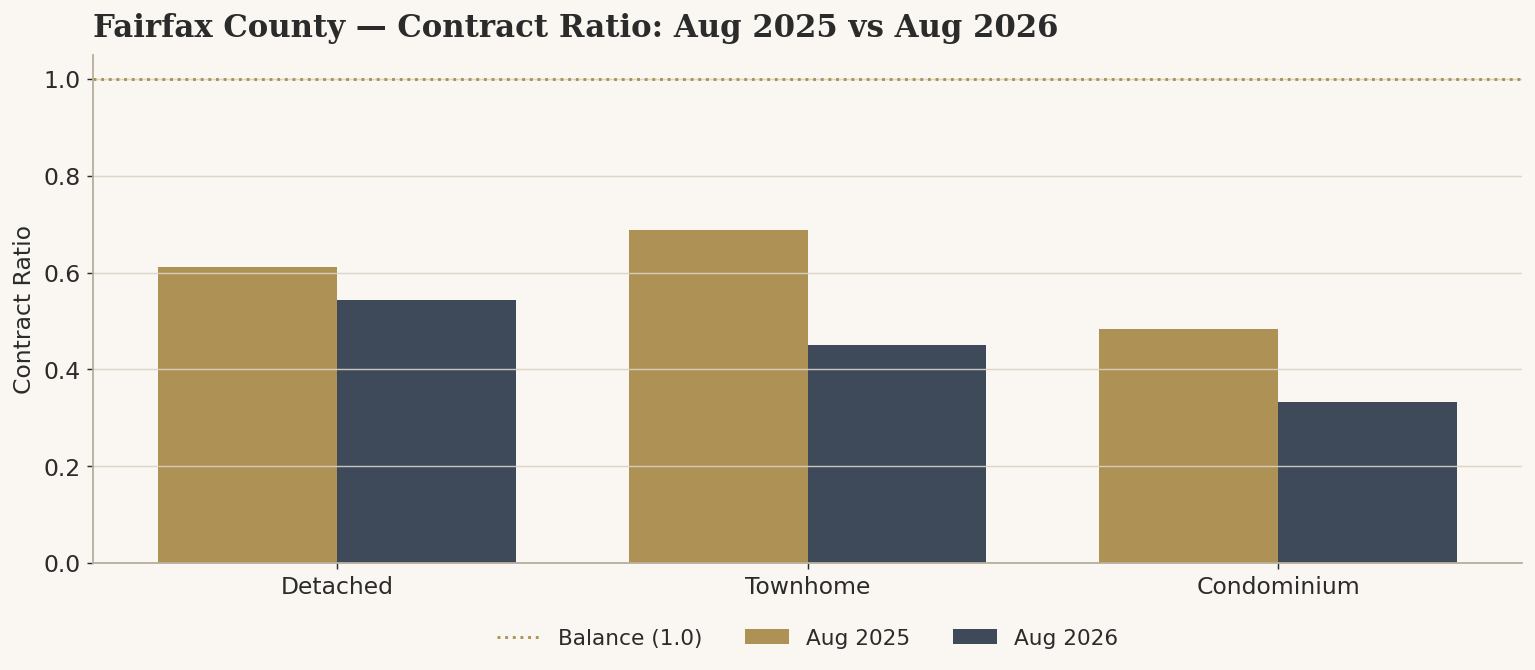
Fairfax County Contract Ratio, August 2025 vs. August 2026. Gold line = balance (1.0). Source: BrightMLS.
A year ago all three tiers ran stronger; this August every one eased. Detached fell to 0.54 from 0.61, townhome to 0.45 from 0.69, and condominium to 0.33 from 0.48 — and in each tier active listings rose year over year. The whole county tilted modestly toward the buyer, the condo tier most of all. But no tier is in free-fall: the demand didn’t leave the market, it simply stopped racing.
HUDS COMPASS
NORTHERN VIRGINIA’S
ONLY MARKET INTELLIGENCE INDEX
Conditions data tells you what is coming — supply, demand, the direction of pressure. Anyone with an MLS login can pull it. The Compass tells you why — it reads the behavior behind the closings, scoring four needles from every closed sale. And the read tells you how to act. This month’s county report reads the closed side: why detached gave back its premium at the table while prices and speed held, why townhome stayed the disciplined middle, and why the condo tier firmed on the score even as its supply built.
One teaching point unlocks the rest. Most people watch sale-to-list price — but a list price is just an asking number a seller can type at will. Watch sale-to-assessed instead: the county’s assessed value is a fixed anchor that doesn’t move with a seller’s optimism. When a home clears above assessed with no concession, real demand paid up. When it holds its list price but closes with money back at the table, the asking number was a wish the terms quietly corrected.
Detached — the summer premium comes off, countywide
Fairfax County detached is the region’s equity anchor — nearly 200,000 homes, the deepest demand on the corridor. This August it held its value and gave at the table. The typical home sold at a median $947,500, at exactly 100% of list, and still cleared in just 12 days — but the premium came off: sale-to-assessed eased from 110% to 108%, above-list sales fell from 41% to 35%, and concessions rose to 34%. Nearly half of August’s sales — 49% — now close below ask.
On 526 sales, the county’s deepest read, this is the clean countywide pullback: the price held, the speed held, and the give moved to the closing table. The equity underneath is intact — +36.3% since 2020, still rising year to date — so read this as a seasonal easing from a high peak, not a reversal. The representative trade is the 4-to-5-bedroom home: 384 of the 526 sales, at a $950,000 median.
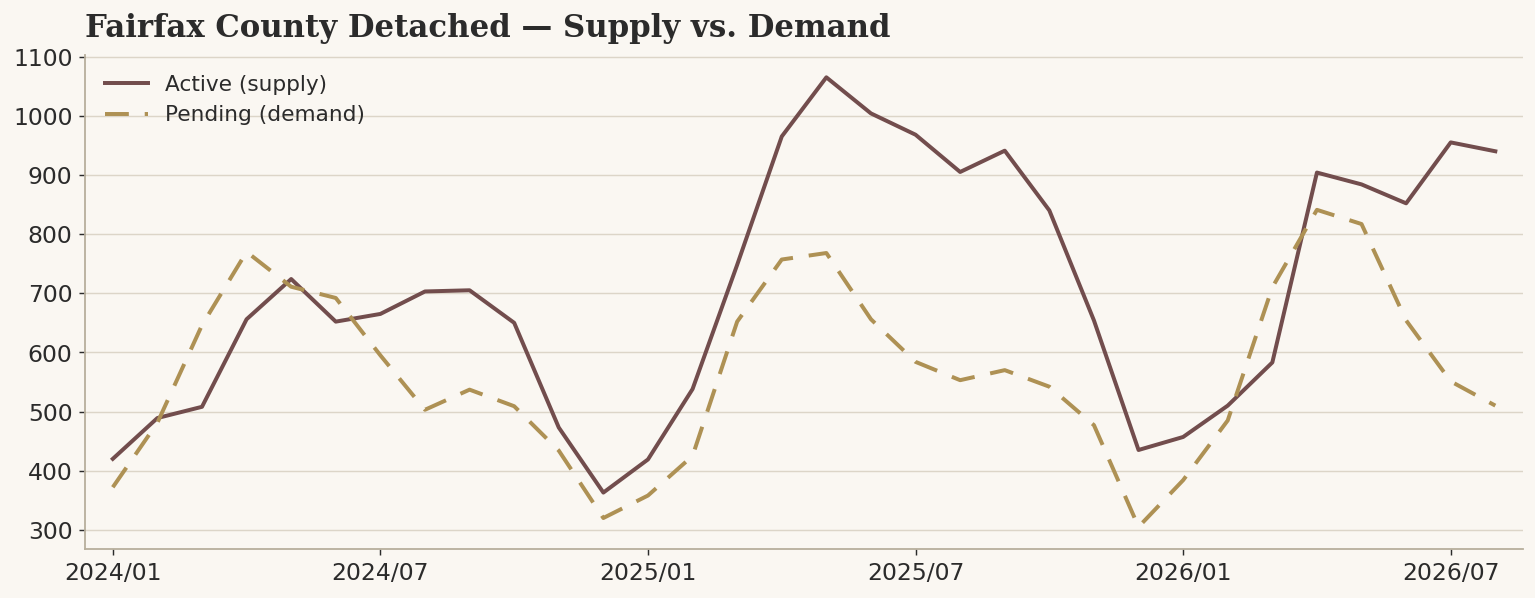
Fairfax County Detached — active vs. pending. Source: BrightMLS.
The equity is intact and the speed held — the premium just moved to the table. Price to today’s comps, build in the give, and the well-shown home still clears in under two weeks.
Townhome — the steady middle holds
Fairfax County townhome is the deep, liquid center of the region — and this August it gave the least ground of the three. Homes sold at a median $635,000, at 100% of list, cleared in 13 days at 105% of assessed, and held the county’s firmest discipline needle (Strategy 71). The score eased just 0.8 to 69.2, the top tier in the county.
Terms softened only slightly, and the long arc holds: +33.3% cumulative equity since 2020, flat year to date as the market caught its breath. The representative trade is the 3-bedroom townhome — 223 of 317 sales at a $640,000 median. The one caveat is supply: active listings climbed from 360 to 587 year over year, so even a firm tier now sits in a longer line.
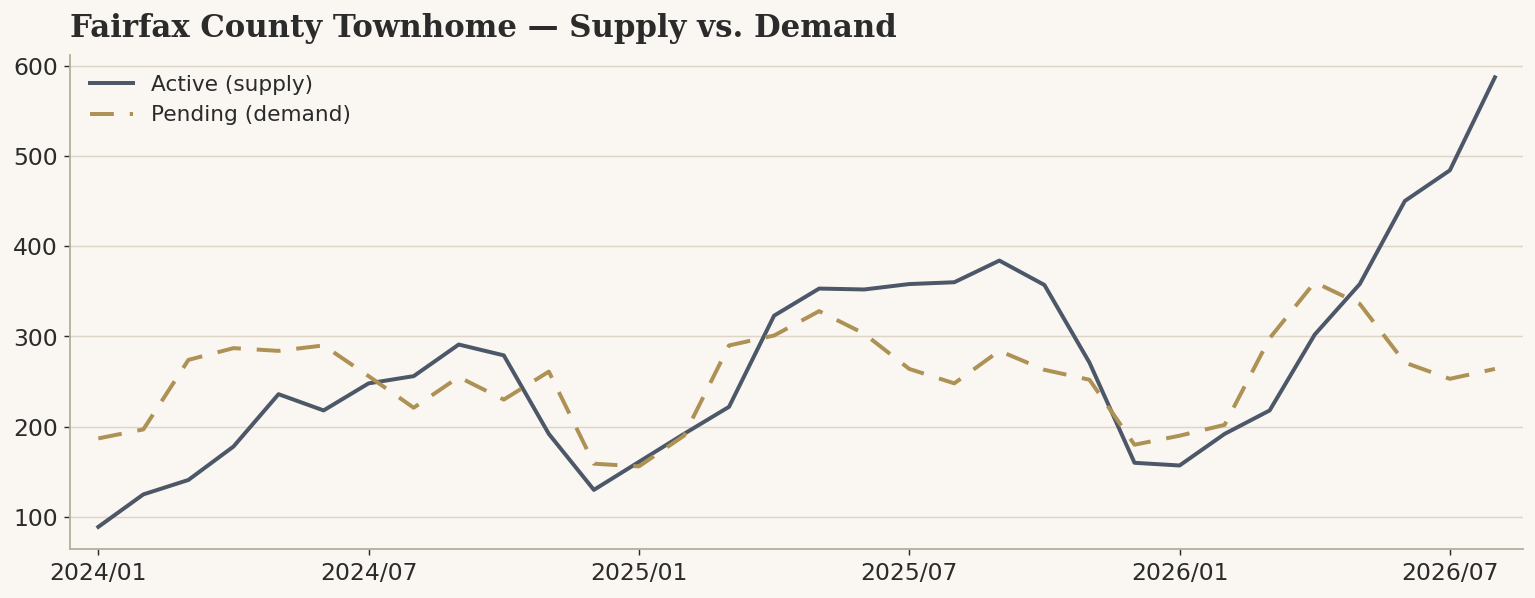
Fairfax County Townhome — active vs. pending. Source: BrightMLS.
Compete on the number — expect modest room on terms, not deep cuts. The disciplined middle still clears in two weeks.
Condominium — the county’s lone gainer
The condo tier was the only structure in the county to firm this August, up 1.7 to 66.2. The entry tier held its price — a median $350,000, sold near list — and cleared faster, a 24-day median down from 28, as demand steadied. Strategy reads 75, strong: sellers priced with discipline and the market met them.
But read the firmness for what it is. Below-list sales still run at 60%, concessions near 43%, and supply has built to 3.8 months on 157 sales — the deepest inventory of the county’s three tiers. The equity line stays measured: +17% since 2020, roughly flat year to date — this tier holds value more than it compounds. The net is an entry door that’s turning up underneath while the patient buyer still holds real room.
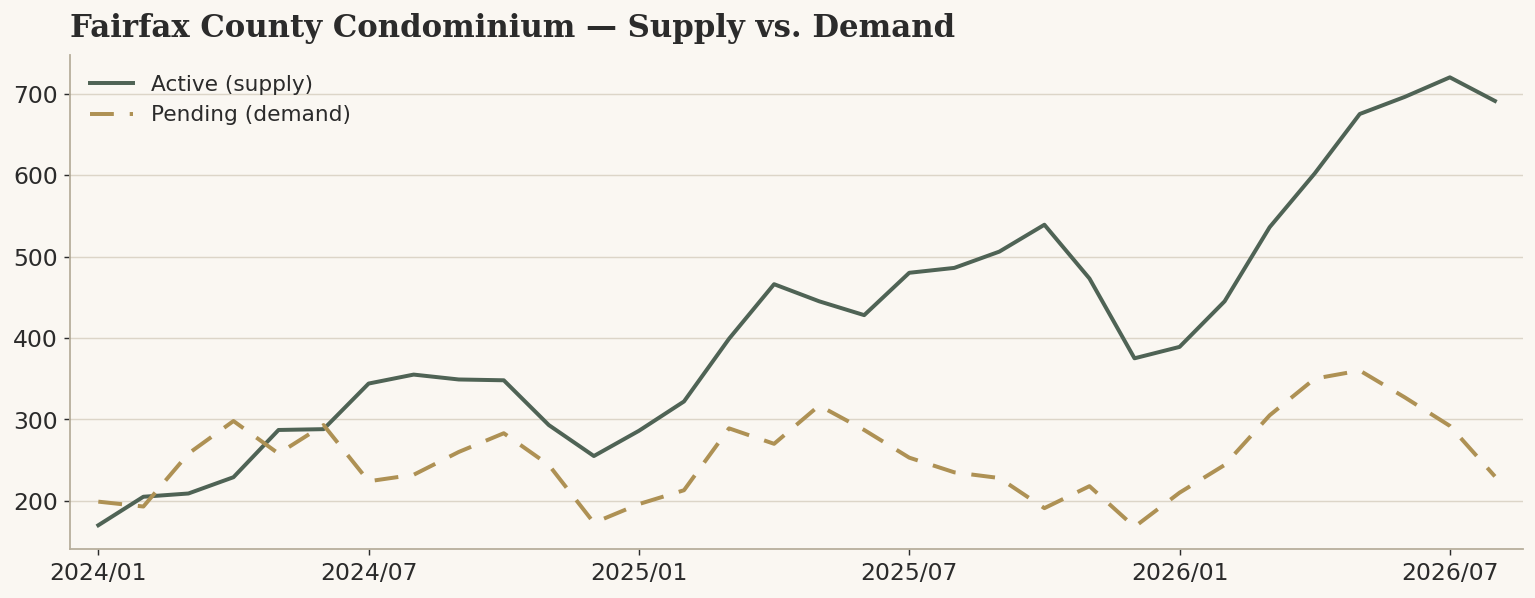
Fairfax County Condominium — active vs. pending. Source: BrightMLS.
Firming demand, real leverage — the patient entry buyer’s tier this fall. Move on the right unit rather than waiting for a softer one.
FOR SELLERS
Fairfax County still pays full value for the right home — but across every tier, “the right home” now means priced to today and shown move-in ready. The give this fall is in the terms.
DETACHED: Your equity is deep and intact, and the clean home still clears in under two weeks. But nearly half of county sales now close below list, so price to today’s comps and build a modest concession into your number rather than your asking price.
TOWNHOME: You’re the firmest tier in the county — hold your number with discipline. Just know supply grew by more than a third this year, so the reaching listing waits in a longer line.
CONDOMINIUM: Nearly four months of supply rewards the move-in-ready unit and makes the reaching one sit. Price realistically and the firming demand will meet you.
FOR BUYERS
The county tilted modestly your way this fall — gently in detached and townhome, more decisively in condo. Know which tier you’re in.
DETACHED: Your room is in the terms — concessions and below-list closes — more than deep price cuts. Bring a sharp number on the homes that show well; they still move fast.
TOWNHOME: A little more room opened as supply grew, but this tier is firming — move on the right home rather than waiting for softer terms.
CONDOMINIUM: The most leverage in the county: three in five units close below list, concessions are common, and supply gives you time to choose. Read the sale-to-assessed column to see what buyers actually paid.
One number to keep next to your offer: Fairfax County detached carries +36.3% cumulative appreciation since 2020, and the pace has normalized across all three tiers. Offer at today’s level, let the appraisal set the ceiling, and you own an asset instead of an anchor.
WHAT’S NEXT
The leading indicators point to a fall that keeps favoring the prepared buyer and the disciplined seller — gently, across all three tiers, which is the county’s signature.
Contract Ratio — the demand gauge — eased in every tier this August: detached 0.54, townhome 0.45, condo 0.33, all below balance. Watch whether they steady or keep sliding through the fall.
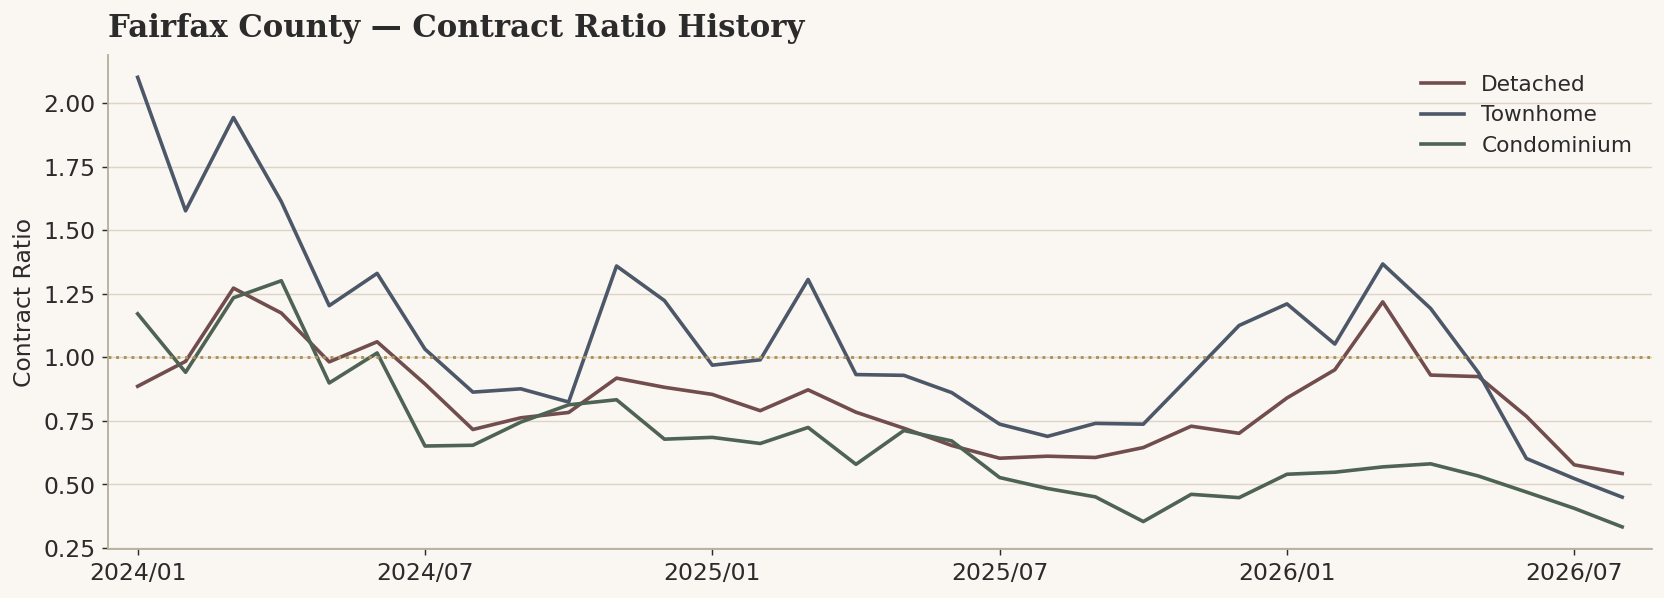
Fairfax County Contract Ratio history by structure. Gold line = balance. Source: BrightMLS.
Months of Supply tells the same story from the inventory side: detached and townhome hold under two months while condo has built to nearly four. That condo overhang is the number to watch into the fall.
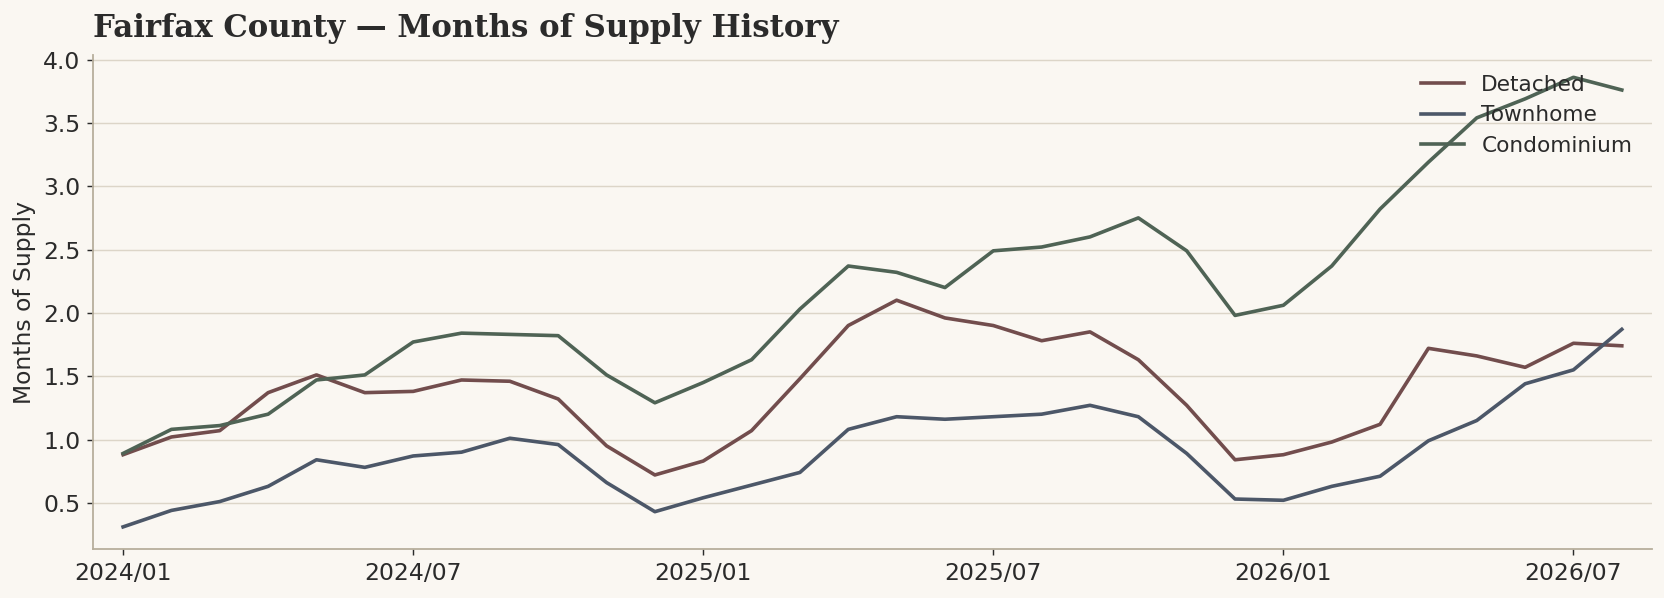
Fairfax County Months of Supply history by structure. Source: BrightMLS.
Fairfax County is the county in whole — the baseline the fourteen are measured against. This August it did what a balanced market does: absorbed the season on terms, not on values. Read the county as your baseline, then read your own market against it.
Curious what your Fairfax County home is really worth this fall?
The median won’t tell you — your tier, your home’s condition, and where you price against assessed value will. That’s the read I bring: not an online estimate, but the behavioral market intelligence behind every closing in your neighborhood. Whether you’re weighing a sale, a purchase, or just want to know where your equity stands, let’s talk.
Michele Hudnall
Real Estate of Northern Virginia | Equity-First Real Estate Strategy
Life Long Northern Virginia Native | 25-Year Reston Resident | HOA Board President, Whitney Park East | South Lakes Drive
[email protected] | 703.867.3436 | RealEstateofNVA.com | @realestateofnva
I help Northern Virginia buyers and sellers make smarter decisions with local market analysis, strategic guidance, and real-world context, not hype headlines.
Disclosure: Michele Hudnall is a licensed real estate agent in Virginia. This post represents her personal analysis and good-faith opinion as a Reston resident and does not constitute legal or financial advice. Full disclosure at RealEstateofNVA.com. All analysis and opinion are my own and based upon local, real-time data. Please consult with a financial or legal professional as required.
Privacy Statement | Disclosure Notice
About the data: Sales data from BrightMLS. Mortgage rates from Freddie Mac (FRED series MORTGAGE30US). Compass behavioral scoring methodology from Michele Hudnall’s proprietary intelligence.